

1. Introduction
2. Mathematical Background
2.1 Long Short Term Memory Model
2.2 Sensitivity of Streamflow to Rainfall using Precipitation Elasticity Concept
3. Study Area
4. Methodology
4.1 Peak Rainfall Scenario
4.2 Gridsearch Hyperparameter Tuning
5. Results and Discussion
5.1 Results of sensitivity of streamflow to rainfall within the watershed
5.2 Results of GridSearch Hyperparameter Tuning
5.3 Model Loss
5.4 Models Evaluation and Discussion
6. Summary and Conclusion
1. Introduction
Recently, the abundant availability of reliable hydrological data coupled with evolution of high performance computer systems with amazing computational power in the form of powerful Graphical Processing Units (GPU) has gained momentum, thereby generating a landslide shift from adoption of physics-based hydrological models to artificial intelligence-driven models (AI). Physics-based models compute complex simulations via numerical and mathematical modeling of the conceptual physical characteristics that make up the system, while AI-driven models feed on data (Jaiswal et al., 2020). The efficient usage of these abundant data to institute policy frameworks for disaster prevention and mitigation will offer promising results for longterm sustainability, resilience and prospects of future opportunities to transform the water sector in upcoming years (Grossman et al., 2015). A very good example of AI models are the Deep Learning (DL) models which harness the benefits of temporal dependencies in reliable data and offer more simplicity to modeling of time series variables in hydrology. These models are regarded as a black box which learn and interpret complex interactions in data to infer scalable and robust results, while reducing manual stress (LeCun et al., 2015). A peculiar benefit of DL is its ability to extract reasonable features from data with lesser instructions, thereby eradicating noise interference in data (Sahiner et al., 2019). However, a good knowledge of hydrological data is required for easy manipulation and preprocessing.
Reliable streamflow forecasting is quite imperative in water resources planning and management. Accurate streamflow prediction helps to trigger timely early warning systems for flood management, improve efficiency of hydropower plants, and irrigation scheduling (Zhang, 2017). However, temporal variation of streamflow is sporadic, short and exhibits a non-linear time series behavior, making it a very difficult parameter to predict in hydrologic sciences (Ghimire et al., 2021). According to Marugan et al. (2018), AI-driven Artificial Neural Network (ANN) models, Extreme Learning Machine (ELM) and Support Vector Machine (SVM) have been reported to produce better streamflow predictions than the conventional stochastic models such as Auto Regressive Moving Average (ARIMA) and Auto Regressive (AR). Among several AI models employed in hydrology, ANN imitates biological neurons of the brain, which are connected together by dendrites. In another research conducted by Demirel et al. (2009), ANN showed better performance in discharge prediction than the Soil and Water Assessment Tool (SWAT) model.
It is noteworthy to know that AI-driven models may offer inconclusive results and may be difficult to ascertain which model is superior due to some limitations such as overfitting, lack of generalization, stochasticity, and learning divergence for a typical modeling experience but with the advent of Convolutional Neural Network (CNN) and LSTM, better parameterization and more accurate predictions have been recorded and a successful achievement of overcoming the vanishing gradient problems. Applications of these two models have been reported in evaluation of length of training data for river management (Park et al., 2020), solar radiation prediction (Ghimire et al., 2019), stock price forecasting (Vidal and Kristjanpoller, 2020), detection of arrhythmias in electrocardiograms (ECG) (Oh et al., 2018), prediction of tool wear in manufacturing industries (Zhao et al., 2017), wind speed prediction (Meka et al., 2021), and a host of other interesting applications currently being adopted in developed countries. Also, it is common practice for researchers to focus more on model accuracy than understanding the hydrology that guides the study. Therefore, the current study considered three main hydrological drivers (daily water level, daily streamflow and daily rainfall amount) of the piney watershed to predict streamflow. The aim of the study is to determine whether the LSTM model could predict streamflow during peak rainfall events.
2. Mathematical Background
2.1 Long Short Term Memory Model
The Long Short Term Memory (LSTM) model is a type of recurrent neural network which was developed to proffer solutions to the vanishing gradient problem using backpropagation. LSTM model learns long term dependencies from non-linear, complex time series data using gates and cell states (Hochreiter and Schmidhuber, 1997). A typical LSTM model comprises the cell state, input gate, output gate and forget gate. The gates determine internal routine mechanisms of the model, process sequences of data as carried by the cell state and coordinate the inflow and outflow of information of each cell. The first internal routine is to discard unnecessary information using the sigmoid layer of the forget gate . As the name implies, the input gate, determines input values to update memory state with the use of sigmoid layer and a tanh layer which creates a vector of candidate values . The old cell state Ct-1 gets updated to a new state Ct, while the output gate ot regulates the output values based on input values and memory block. The forget gate selects what to ignore from the block. Different kinds of LSTM models include Vanilla LSTM, Bidirectional LSTM, Stacked LSTM, Encoder-Decoder LSTM etc. A simpler LSTM architecture which combines the input and forget gates into one ‘update gate’ is regarded as the Gated Recurrent Unit, GRU (Cho et al., 2014). Fig. 1 shows a simple LSTM model architecture. Equations (1), (2), (3), (4), (5) show mathematical equations governing the LSTM internal processes.
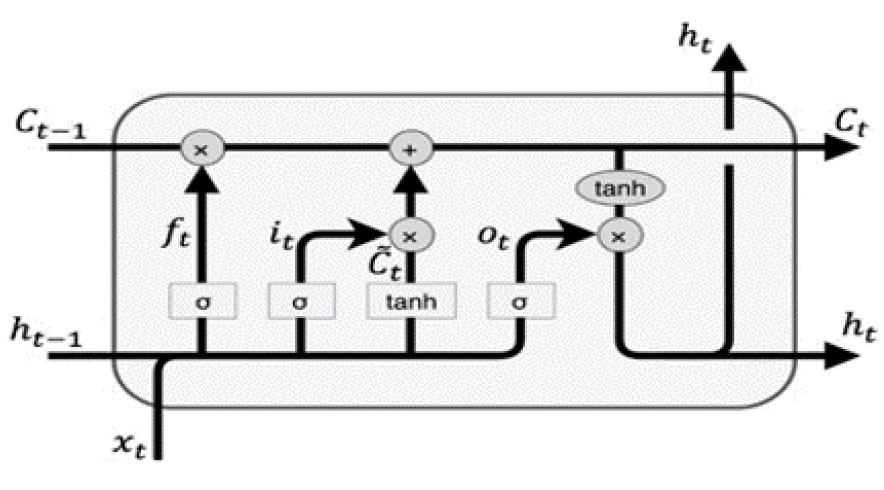
where: w, b, h are weights, biases, and states with defined subscripts
2.2 Sensitivity of Streamflow to Rainfall using Precipitation Elasticity Concept
Climate change effect in the form of irregular peak rainfall distribution in the United States is generating a serious cause for concern. Heavy downpour has wrecked devastating effects on water channels, causing massive urban and river flooding. Since climate is the main driver of most hydrological processes, it is therefore important to understand the sensitivity of streamflow to climate (rainfall in this context). According to Chiew and McMahon (2002), traditional method of streamflow sensitivity is performed using calibrated hydrological models by comparing streamflow estimates from the present climate scenario to the streamflow estimates from a perturbed climate. Alternatively, for this study, we evaluated the sensitivity of streamflow to rainfall directly from annual, concurrent data of rainfall and streamflow within the same temporal range, using the non-parametric estimator, presented by Sankarasubramaniam et al. (2001). A good knowledge of estimator can give hydrologists and disaster managers a reasonable idea of the contribution of rainfall to streamflow, especially during peak rainfall events. Equation (6) presents the estimator.
where: and are mean annual streamflow and precipitation respectively;Qt and Pt are corresponding values of streamflow and precipitation at time t.
3. Study Area
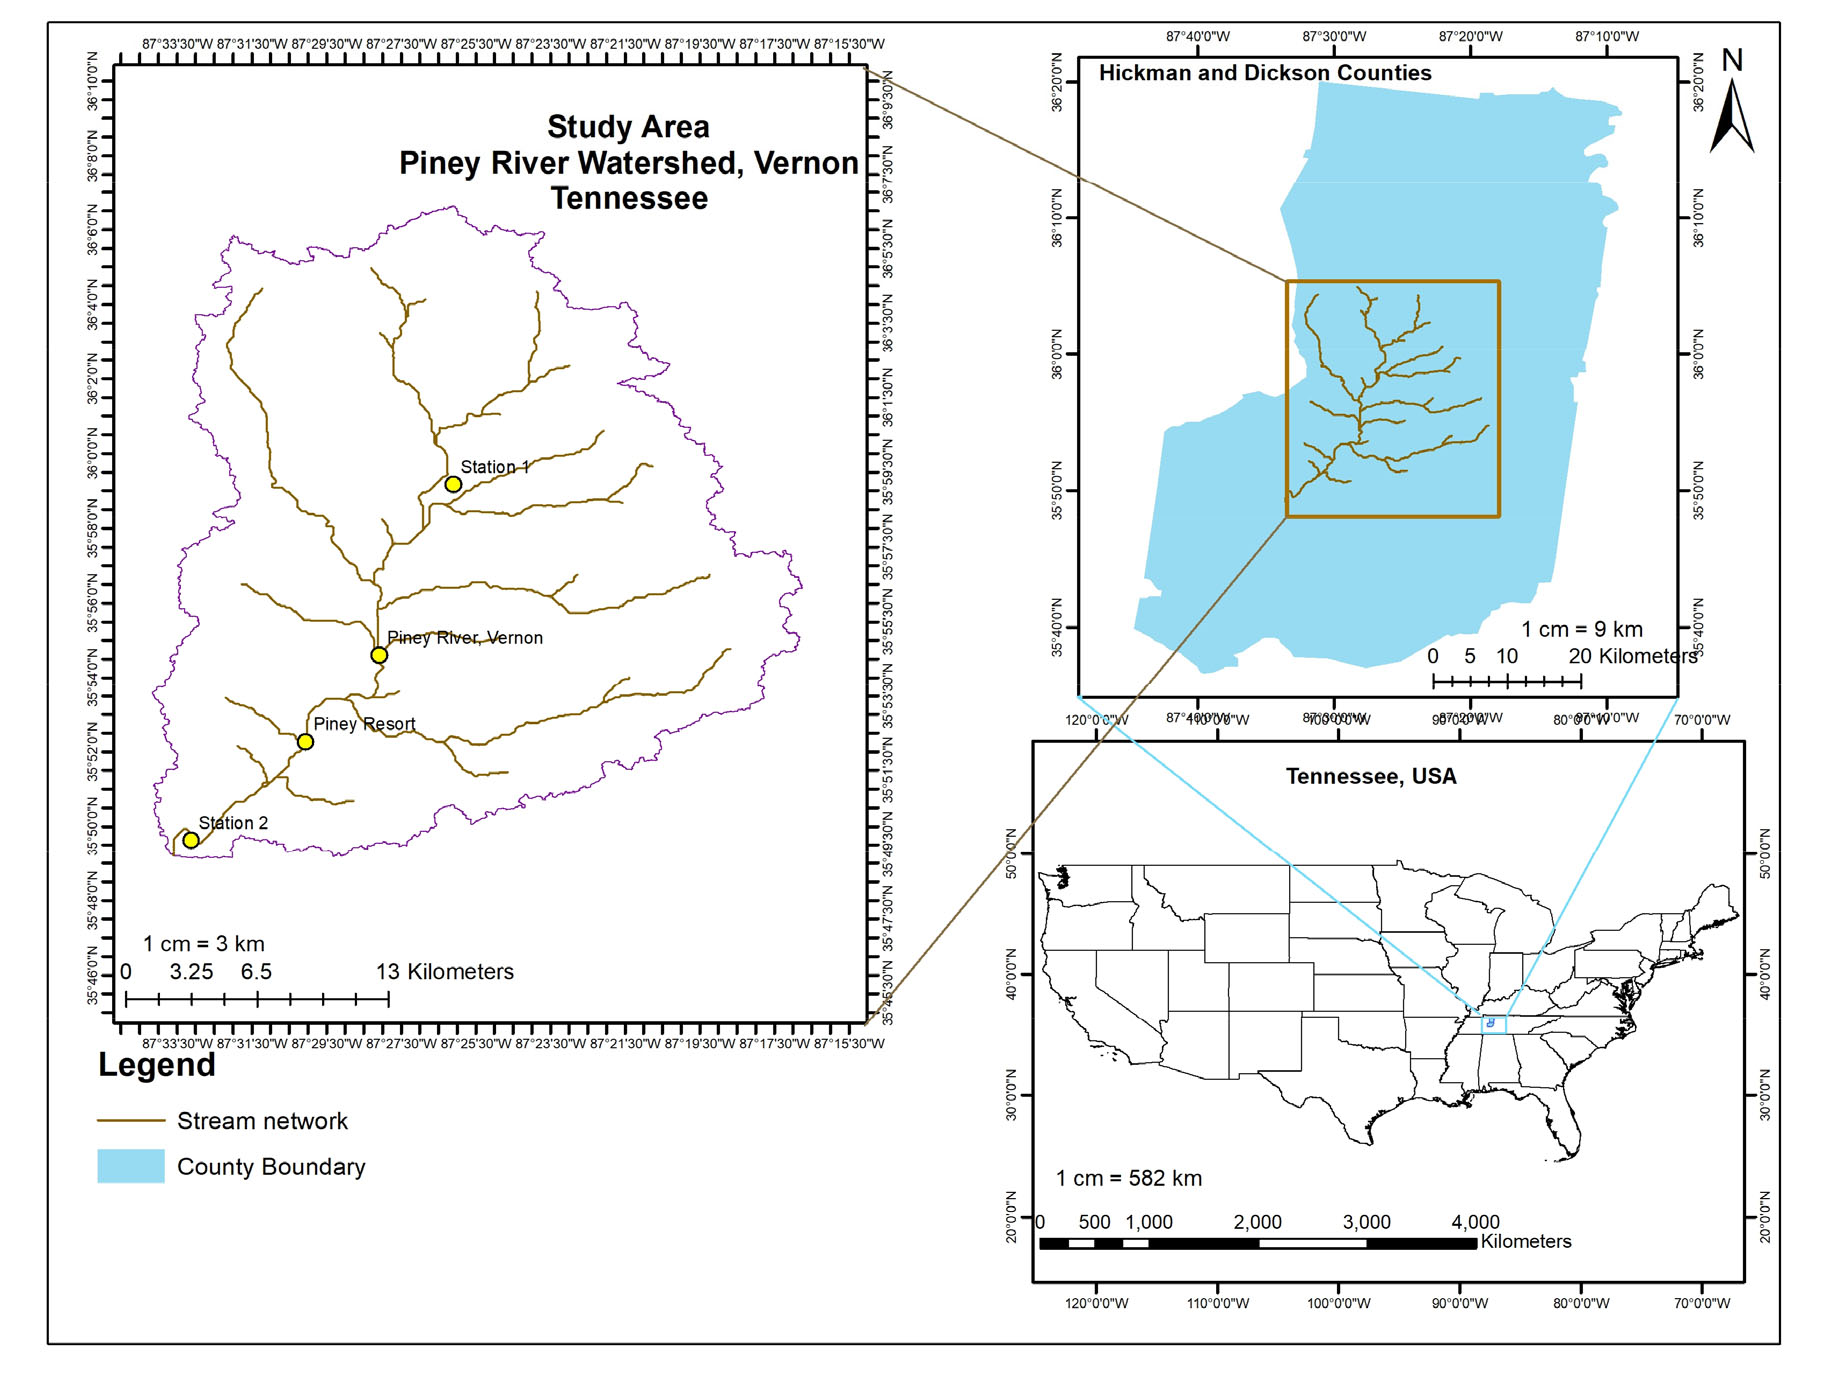
The study was conducted at the Piney River watershed located between Latitude 39° 49’ 9’’ N and Longitude 87° 33’ 34’’ W, at Vernon, Middle Tennessee, USA. The Piney River is a transboundary river with about 38.1 km river length and drains into the bigger Duck River. It has its headwater tributary in Dickson County and flows southeast through Hickman County. It has an elevation of 128 m with supply from the confluence of West and East Piney Rivers upstream Mount Sinai. A famous recreation center along the watercourse is the Piney River Resort, which was flooded on August 24th, 2021 due to 0.38 m heavy rainfall within 24 hours. The riverbanks were overflown and assets like cars and dogs were submerged and swept away, claiming properties and about twenty deaths. There was a need to explore forecasting potentials of LSTM using historical hydrometeorological data and simulating the peak event in the region. This will help to examine whether the model could have predicted the danger ahead of time, and to create well-informed policies for future disaster mitigation policies. Fig. 2(a) and (b) show the flooded piney resort and USGS streamflow record for that day respectively. Fig. 3 shows the Piney River stream network and spatial distribution of USGS stations (USGS 03602500 and USGS 03599500) within the catchment.
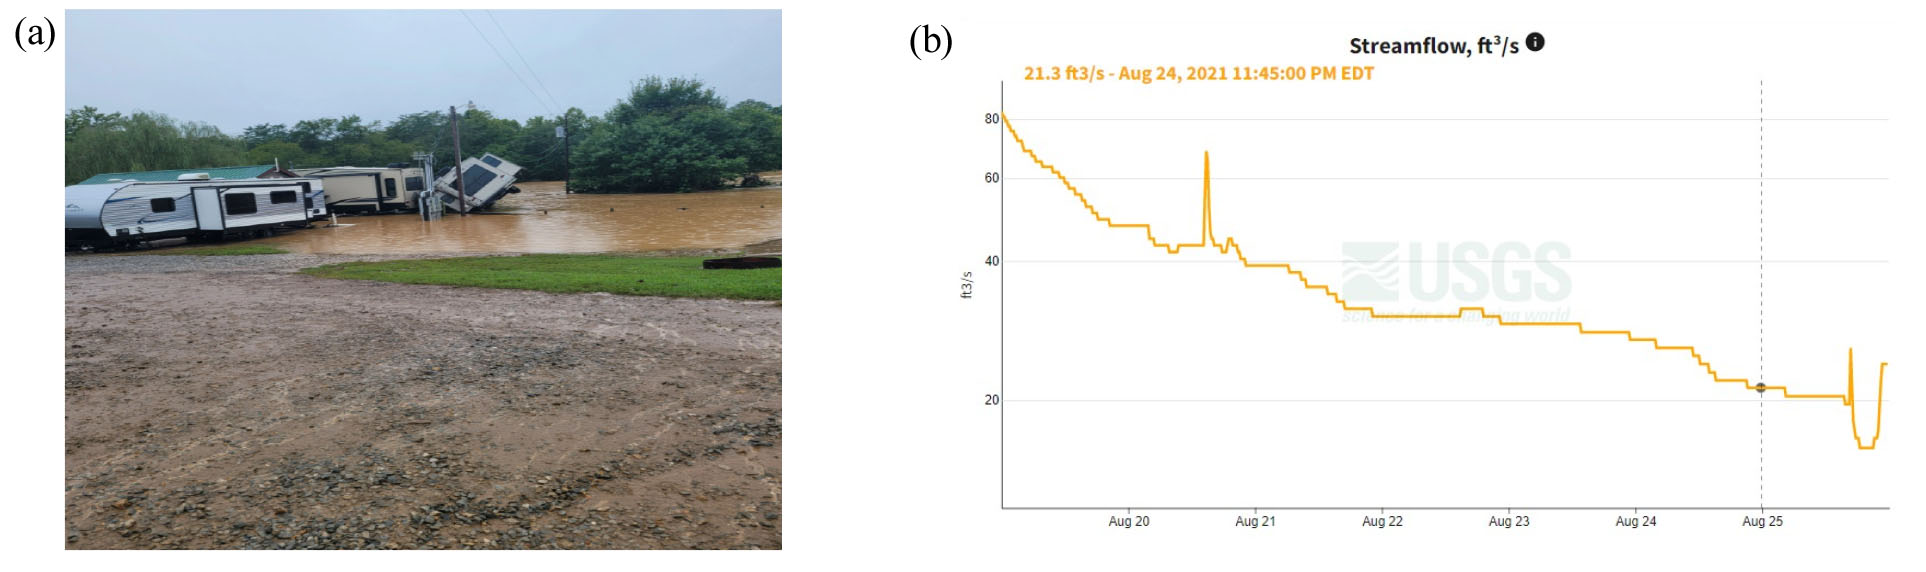
Fig. 2.
Flooded resort and USGS streamflow for the event (Sources: (a) WKRN (2021), (b) https://waterdata.usgs.gov/nwis/uv?site_no=03602500
4. Methodology
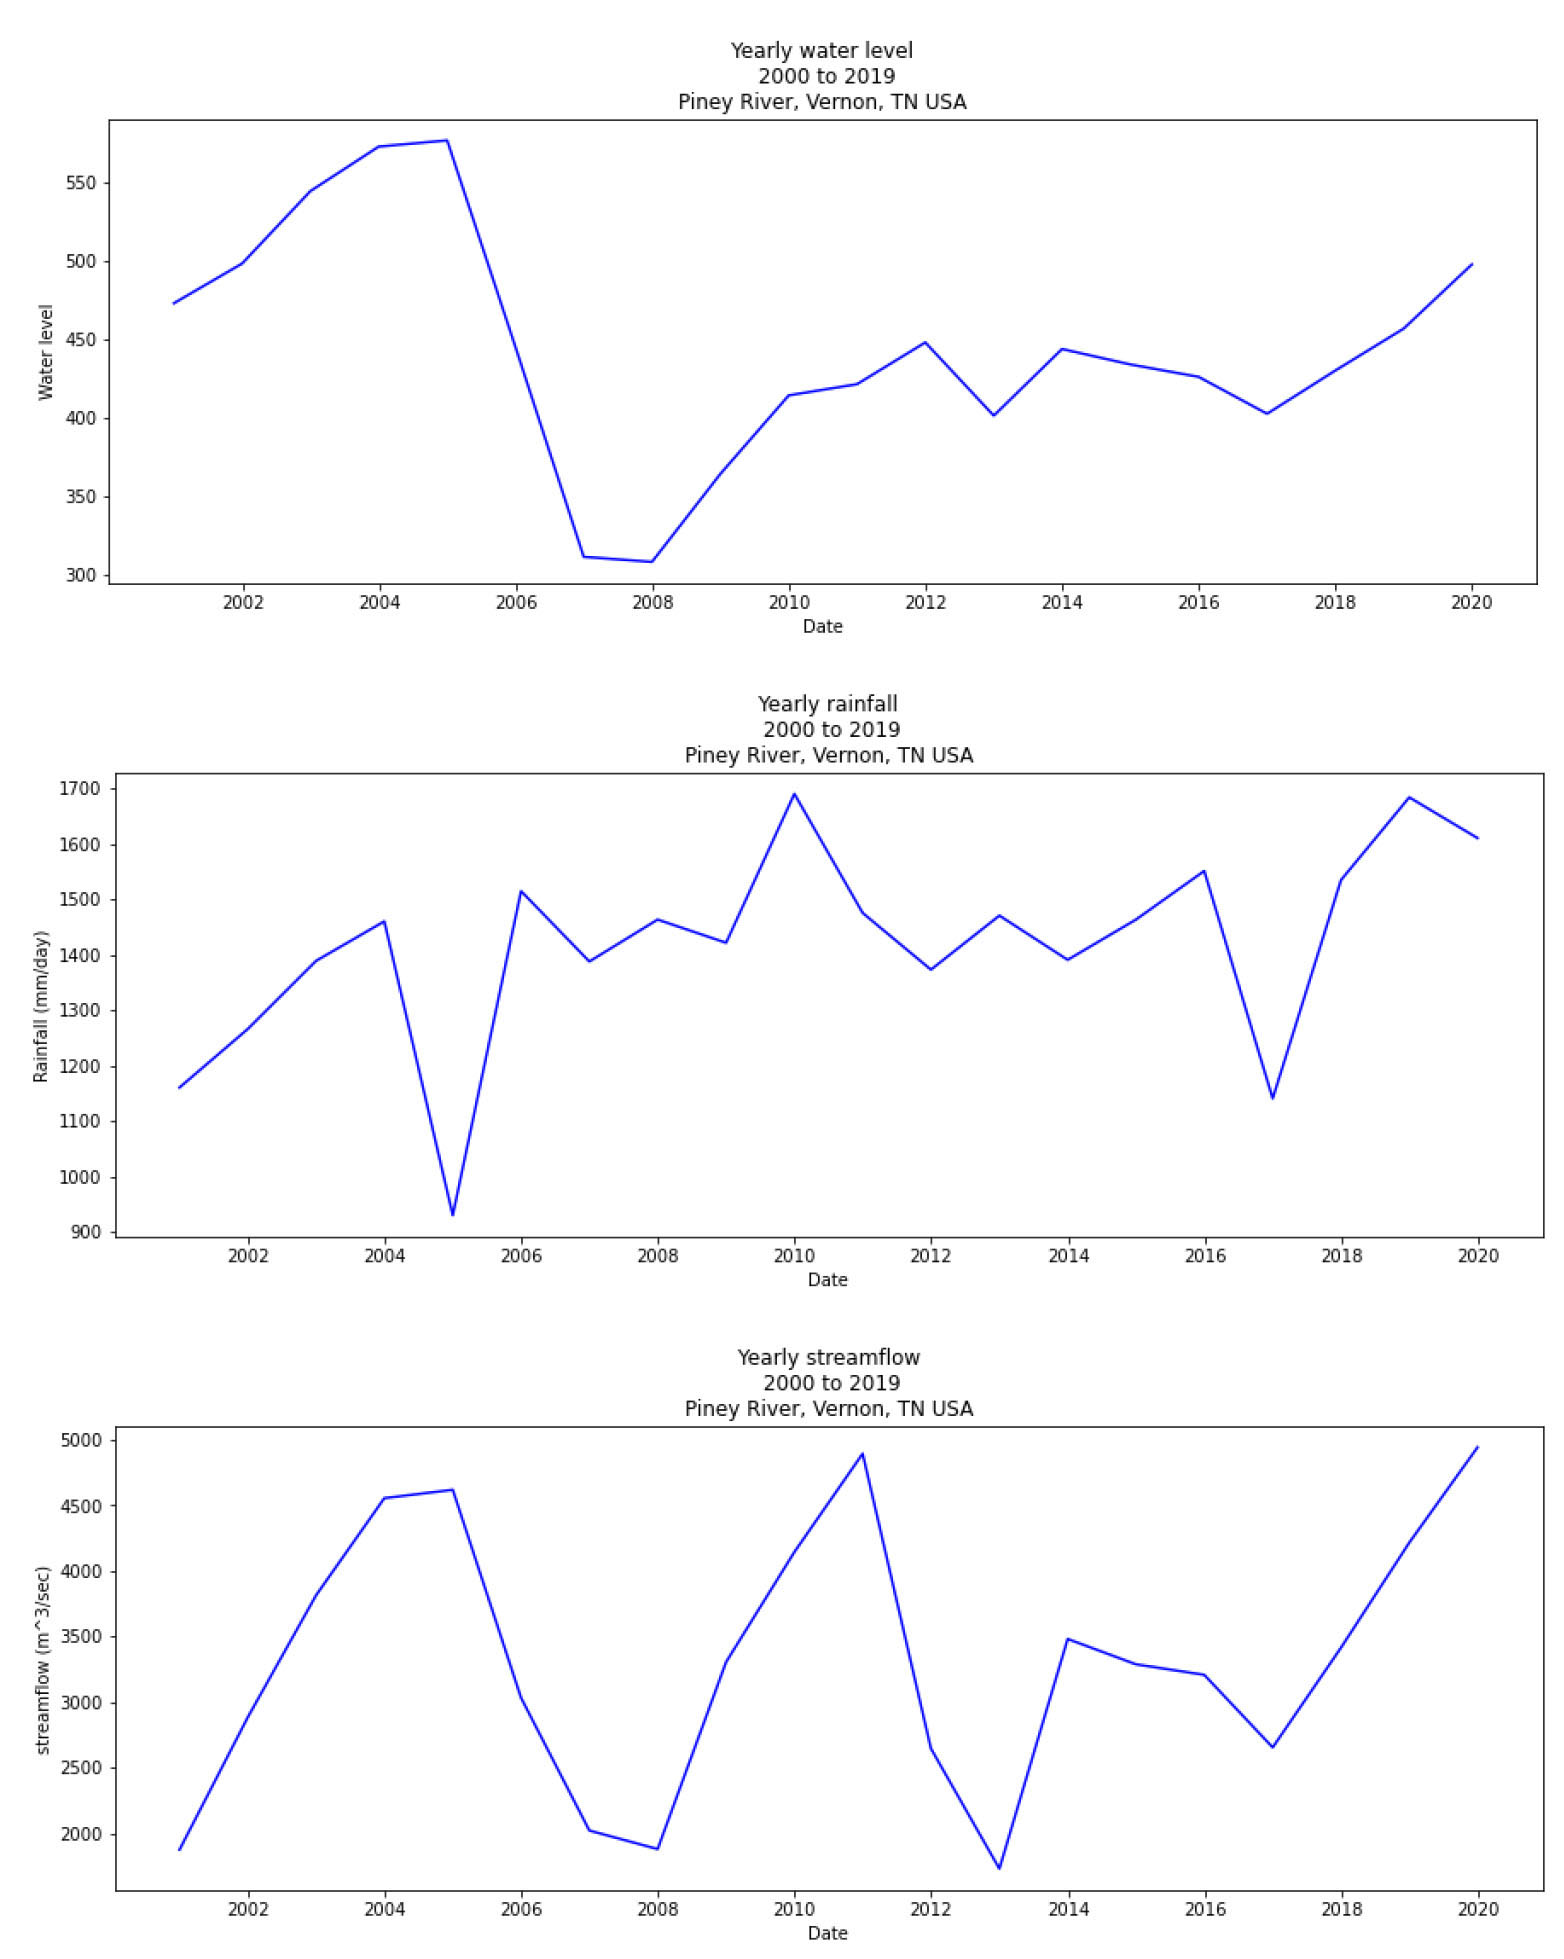
Twenty (20) years daily hydrometeorological data of water level, streamflow, and rainfall from 01-01-2000 to 12/31/2019 were obtained from the USGS website from two USGS stations (USGS 03602500 and USGS 03599500) within the study area. Data was preprocessed and missing data was filled with climate data from National Oceanic and Atmospheric Administration (NOAA). Data was divided into 80% train and 20% test sets. Fig. 4 shows the yearly distribution of input data over the study period, and it can be observed that there is a linear relationship between the yearly trend of rainfall and streamflow values. Cumulative yearly rainfall of about 1700 mm/day was highest in year 2010 with a corresponding peak streamflow of 4700 m3/s. The deep learning modeling was conducted in Python with Tensorflow and Keras as backend machine learning frameworks.
4.1 Peak Rainfall Scenario
After the first phase of model evaluation on raw data, an out-of-sample peak rainfall scenario was simulated by adding 0.3 m of rainfall to each rainfall data to simulate the peak rainfall that occurred on August 24, 2021 in the watershed and evaluated. In simple terms, the study tried to model the exact rainfall event that occurred on the day by using peak rainfall data reported by USGS for that particular day to simulate peak rainfall of the LSTM models by feeding individual inputs of water level, rainfall and streamflow data, and then, a combination of these input variables. The learning capabilities of the four models were tested.
4.2 Gridsearch Hyperparameter Tuning
Gridsearch tuning was performed for model parameters that can be controlled by the modeler using KerasRegressor from Scikit_learn. These include number of neurons, number of epochs, optimizer, activation function and batch size.
To obtain optimal hyperparameters, an exhaustive GridSearch tuning was conducted by considering two criteria:
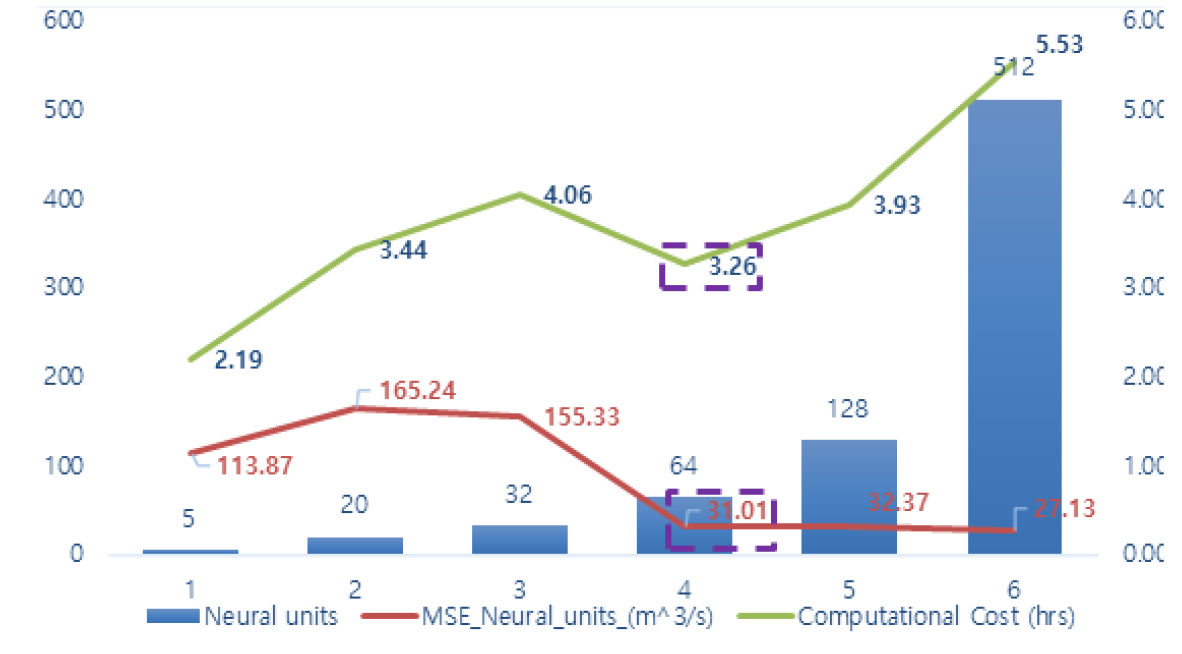
1. Simplicity of benchmark models: Based on how deep the LSTM model will get, in terms of number of neural units (neurons), so, we parameterized 5, 20, 32, 64, 128, and 512 neurons for the single-layered LSTM and selected optimal LSTM model which returned the lowest MSE after the search;
2. Computational cost: It is a measure of the amount of computer resources required to conduct each successful GridSearch routine for every developed model. Although there were abundant computer resources for the study (Intel(R) CoreTM i7, dual core 3.80 GHz, 3.79 GHZ processor and 64 GB RAM), however, the aim was to achieve a cost-effective, optimal and simple model LSTM model that trained faster for proper time management. A final LSTM baseline model was obtained and fitted using different input variables as shown in Table 1.
5. Results and Discussion
The results of sensitivity of streamflow to rainfall, gridsearch results, model skill and model evaluation for normal and peak rainfall scenarios and discussion are presented in this section.
5.1 Results of sensitivity of streamflow to rainfall within the watershed
Evaluation of precipitation elasticity (εP) using the non-parametric estimator presented by Sankarasubramaniam et al. (2001) showed that the sensitivity of streamflow to rainfall was estimated as εP = 2.3. This can be interpreted as a 1% change in mean annual precipitation within the watershed will result in a 2.3% change in mean annual streamflow. Although this might appear low but on a yearly temporal scale, it might be significant because it confirms the fact that changes in streamflow are amplified in changes in precipitation (rainfall precisely). This linear relationship between rainfall and streamflow was supported in the study of Chiew (2006), which showed a high correlation between εP values obtained theoretically and those obtained from Monte-Carlo experiments in US and Australian catchments. For this research, this theoretical εP value will be verified with the developed LSTM models to indicate whether rainfall is the main driver of streamflow or a combination of other input parameters for the study period.
5.2 Results of GridSearch Hyperparameter Tuning
Results of GridSearch for optimal baseline model based on number of neurons and computational cost are presented in Fig. 5. It can be observed that the most optimal baseline LSTM model had a 64 neuron with the lowest MSE = 31.01 m3/s and trained for a considerable 3.26 hours, which falls within the median computational cost. The resulting final baseline model had model architecture of LSTM layer, 64 neurons, ReLu activation function, 0.1% Dropout, Adam optimizer, 128 batch size and 100 epochs and was used to train and evaluate the four models in Table 1.
5.3 Model Loss
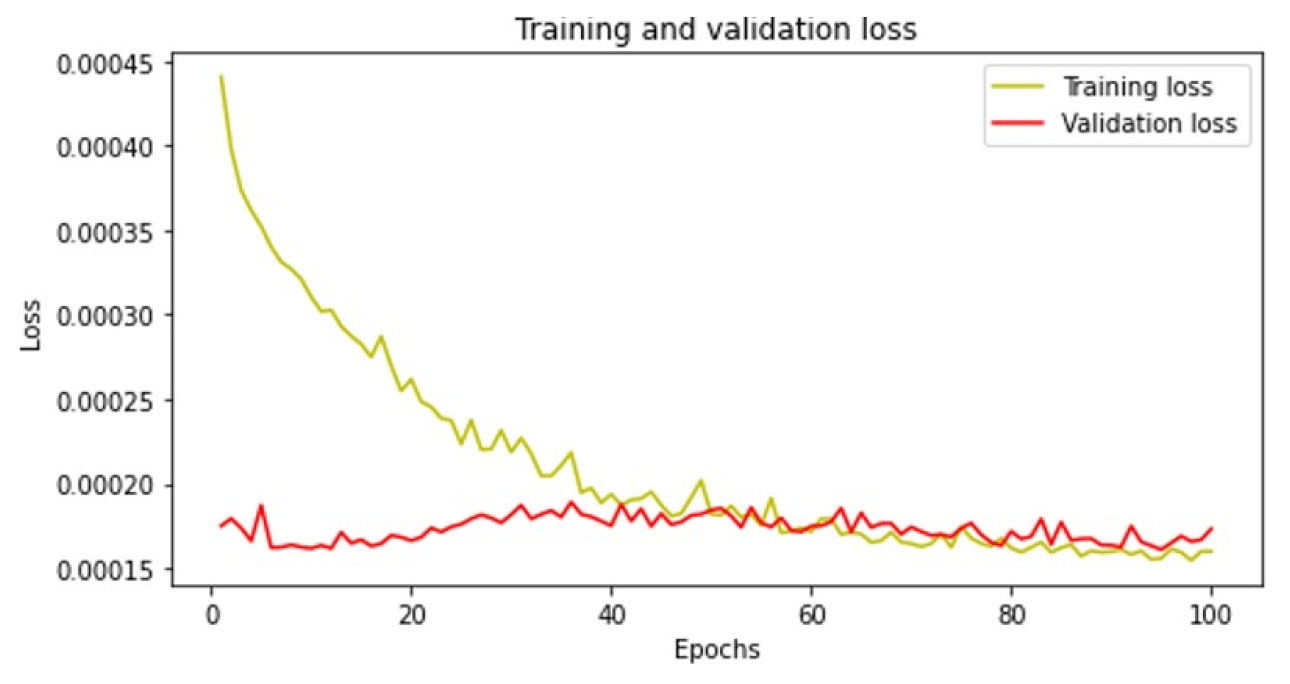
The mean squared error was employed to examine how train and validation losses reduced per epoch. It can be observed from Fig. 6 that when full input data of water level, streamflow and rainfall were used, the model converged faster at an epoch of 50, a point where training can be stopped for optimal results.
5.4 Models Evaluation and Discussion
In deep learning regression tasks, it is a common practice to compare performance evaluation of models with a Naïve or Persistence model which assumes that the future value of a time series is estimated under the assumption that nothing changes between the current time and the forecast time. This evaluates the skill of the model. Analysis of the model skill for the four developed models showed that the LSTMR, LSTMST and LSTMWL could not outperform the persistence model with NSE slightly below that of the persistence (0.10 < 0.23 < 0.42 < Naïve = 0.55 respectively). The full data model performed best (LSTMFULL NSE = 0.68 > Naïve 0.55).
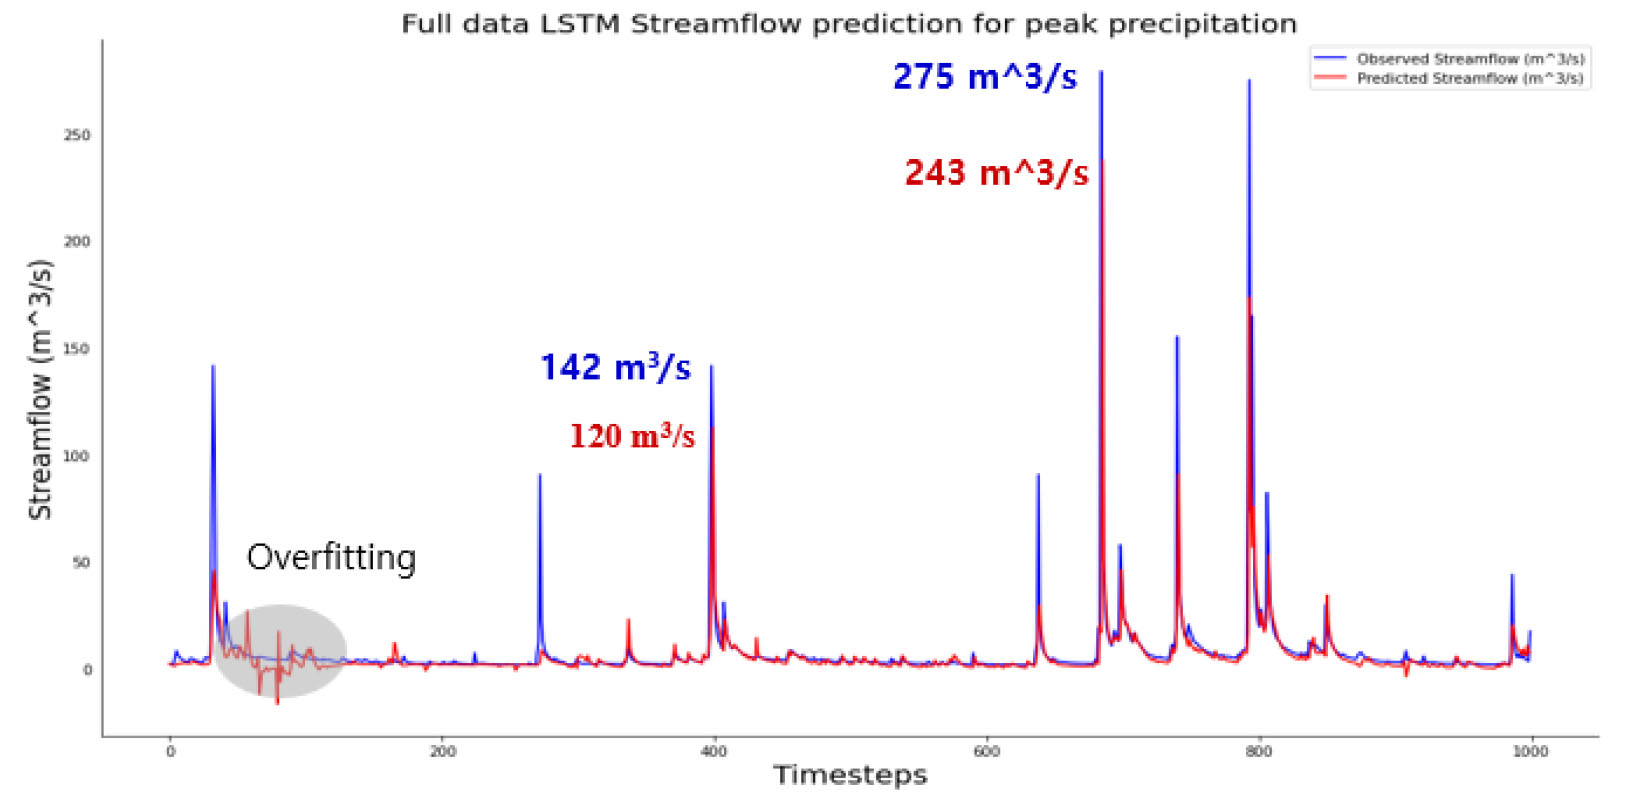
Therefore, we focused more on analysis of the full data LSTM because it can be concluded that rainfall, streamflow, and water level cannot individually capture the temporal dependencies to predict streamflow. Therefore, the theoretical precipitation elasticity of 2.3 was insufficient to evaluate the contribution of rainfall to streamflow for the study area. Model performance increases with addition of more relevant data. Therefore, a combination of all input data can sufficiently predict streamflow during peak and off-peak rainfall events with lowest maximum prediction error (PEmax) of 94 m3/s of streamflow for peak rainfall condition. The study did not consider the addition of rainfall as input for LSTMWL and LSTMSF models. Table 2 shows model performance results. Fig. 7 shows best model prediction using full data. From Fig. 7, although, LSTMFULL shows inadequacies in predicting peak flows accurately, but it performed optimally over other models and can be improved through the incorporation of other static and dynamic hydrological parameters like meteorological forcings, DEM, and slope that drive streamflow.
Table 2.
Performance evaluation of models
6. Summary and Conclusion
A simple one layered LSTM model captured hydrologic knowledge of water level, rainfall, and streamflow of piney river watershed to sufficiently predict streamflow fluctuations during peak and off-peak rainfall events with an NSE of 0.68 and lowest percentage prediction error of 11.6% between ground truth streamflow and predicted streamflow. As a result of the lowest prediction eror during peak rainfall events, the developed optimal LSTM model which used full data (water level, rainfall and streamflow) could have predicted the piney river streamflow rise during the flooding incident iin August 2021. It is right to state that there were few irregular spikes in observed data due to human error or instrumentation error during data collection at gage sites. Hydrologist and disaster managers can employ deep learning applications in proposing different climate scenario, with a view of forecasting possible water disaster ahead. Finally, machine learning models can successfully estimate hard-to-reach and computationally-expensive hydrologic modeling applications, without a physical model or as hybrid models, but only when given detailed information that governs the hydrology of such a catchment.
