

1. Introduction
2. Numerical Study
2.1 Geometric condition
2.2 Numerical method
2.3 Boundary condition and case study
3. Result and Discussion
3.1 Characteristics on the velocity
3.2 Characteristics on the pressure drop
4. Conclusion
1. Introduction
The corrugated pipe is a pipe with a corrugated shape of the pipe wall, unlike a circular pipe. Corrugated pipes are mainly used in fire sites or sprinkler piping because they have the advantage of responding well to damage caused by deformation. However, due to the corrugated shape of the pipe wall, complicated flow phenomena occur inside the pipe, unlike the circular pipe. This flow characteristic makes it difficult to predict the pressure drop, which is an important factor in pipe flow. In order to consider the effect of pressure drop, the equation of Darcy-Weisbach was well applied and represented as follows equation (1),
where Δp is the pressure drop, f is friction factor, l is pipe length, D is the pipe diameter, and V is the average velocity. In practice, therefore, when transporting to the desired discharge throughout the pipe, engineers consider the loss of force in advance which leads the pressure drop phenomena, from various secondary devices, such as piping, valves, etc., to design outputs. Furthermore, there are far more implication factors such as roughness, geometric condition, and so on, affecting changes in fluid motion, vortex flow, energy transport, and pressure drop simultaneously in pipe flow.
Taking into consideration of the groove effect, with different shapes on pressure drop, Bernhard and Hsieh (1996) did an experimental study using a corrugate tube having a circular-shaped groove. As a result, there has an intensive pressure drop compared to that of the tube without groove because recirculation flow occurred inside of the groove. Furthermore, it is suggested that if the Reynolds number (Re.) is over 40,000 the pressure drop increases because the main flow of the pipe flows into the groove.
Besides, studies of turbulence flow in discrete rough walls were carried out, and suggested two types of pipes depending on roughness classification, proposed initially by Perry et al. (1969). Vijiapurapu and Cui (2007) did numerical analysis for taking into account the effect of a rectangular shape groove as a function of pipe types, which are D-type, intermediate, and K-type, with different Reynolds number ranging from 50,000 to 100,000. In the case of D-type, it was suggested that the main flow inside the pipe is independent of each other; in other words, the groove has mere implication on the inside of the pipe. When it comes to other types such as intermediate and k-type, the main flow affects the area in the vicinity of the groove or contributes to the overall flow change, respectively. Therefore, it is worth trying to compare with the suggested Re. number as a function of pipe types.
Moreover, Henrique Stel et al. (2010) investigated the effect of the ratio between the distance and the height of groove in pipes in case of less than 5. As part of the result, the main flow and interference occur as the grove length increases even if it is less than 5, which increases the pressure drop. However, it indicated that it had no effect on depth. However, from a hydrodynamic perspective, the energy transferred depends on the height and spacing of the grooves.
In addition, studies have been conducted only to the extent that the ratio of the gap and height of the groove is close to 5, so no changes have been studied in lower cases.
Therefore, in this study, we analyzed the effect of the interaction between main flow and groove in D-type pipes through numerical analysis in case the ratio of the distance and the height of the groove was lower than 5. The ratio, herein, is 2.8, 3.5, and 4.67.
2. Numerical Study
2.1 Geometric condition
In the case of internal flow in the pipe, the flow must be formed fully developed flow, so the entrance region on the pipe was extended based on the area where the corrugated groove was formed by reflecting the equation (2), introduced by Munson et al. (2009).
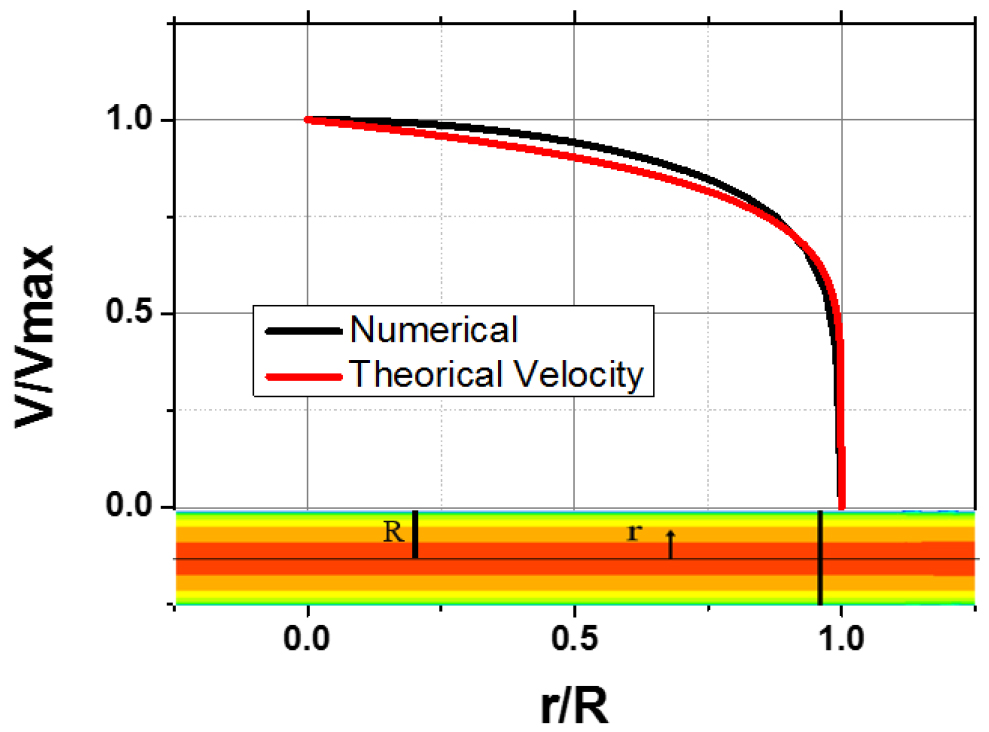
where, Le is the entrance length, and D is the pipe diameter. Additionally, to verify that the flow is fully developed before entering the corrugated pipe, the numerical velocity profile and Power-law velocity profile were compared. Power-law Velocity profile was shown as equation (3), introduced by Munson et al. (2009).
where V is the velocity profile, Vmax is the velocity at the pipe center, R is the pipe radius, and n is constant and depends on the Reynolds number.
Fig. 1 shows the shape of the corrugated pipe reflecting the entrance length. In Fig. 1, P is the distance between groove, L is groove length, and H is groove height.
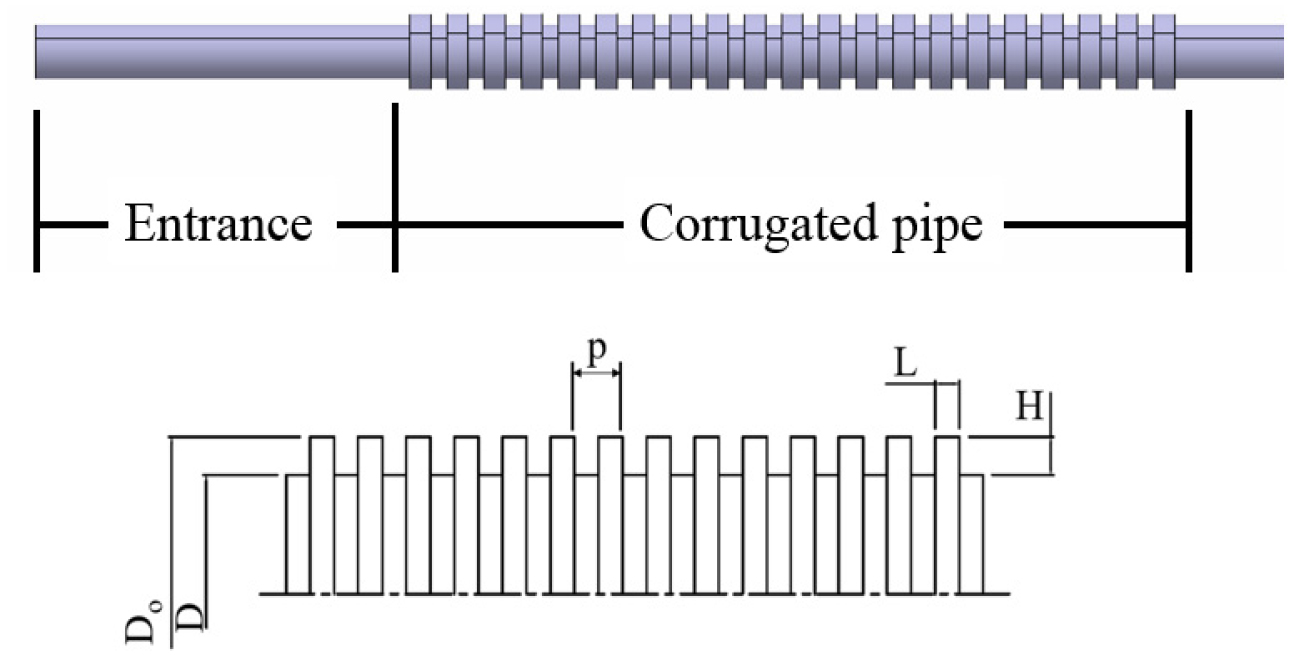
Fig. 2 represents numerical simulation results and calculation results of equation 3 that we would like to analyze in this study. The result was compared with smooth pipe to put emphasis on the effects of grooves. Numerical analysis is one of the fascinating methods to study the variation of flow and pressure changes in pipe research fields.
2.2 Numerical method
This research conducted numerical analysis for the turbulent flow. So, we need the turbulent model for solving the governing equation.
Vijiapurapu and Cui (2010) performed numerical analyzes from 50,000 to 100,000 Reynolds numbers for corrugated pipes with rectangular grooves with an aspect ratio of less than 5. They compare within the corrugated pipe the numerical results of four turbulence models, The Large Eddy Simulation, The Reynolds Stress model, The k - ω SST model, and The standard k - ε model. They obtained results of the same velocity distribution according to the four turbulence models and thus suggested that satisfactory conclusions could be obtained using any turbulence model.
Therefore, in this study, flow phenomena and groove effects were analyzed using the commercial package Ansys 18.1 together with the k-ε standard model, which is mainly used in references.
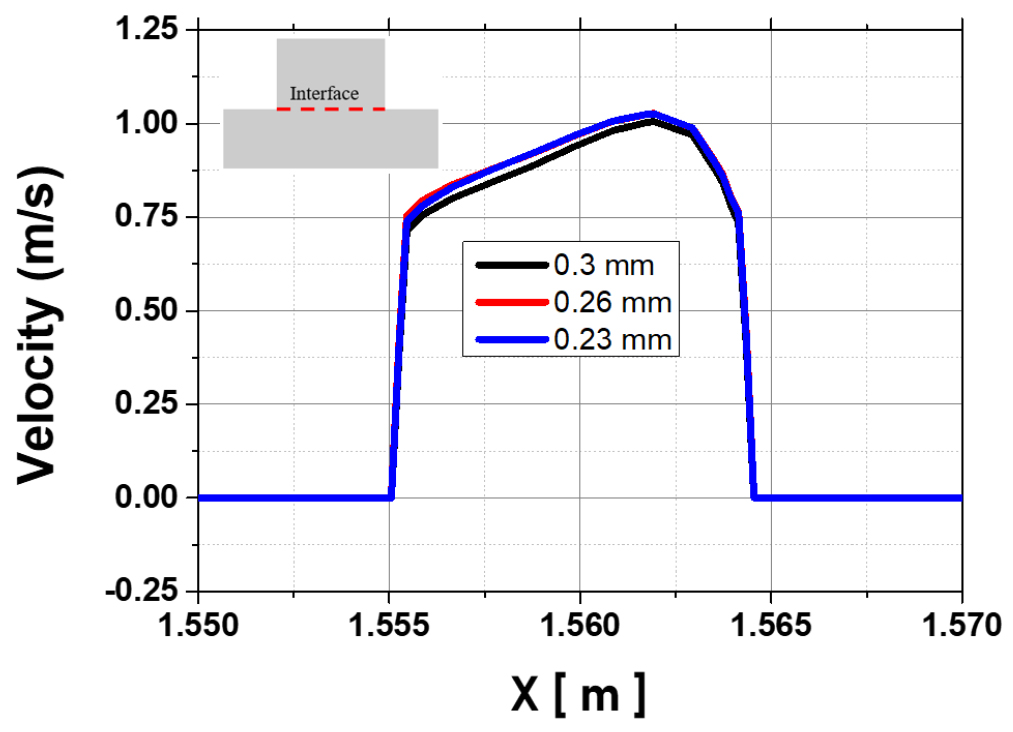
A grid independence test was conducted to obtain accurate analysis results and choose an appropriate grid size. Thus, a grid test was performed on the velocity, and the grid size of the y-axis was changed to indicate the variation in flow within the groove. It was performed by increasing the number of grids from approximately 750,000 to around 1,000,000, and chosen 880,000 numbers of grids, as shown in Fig. 3.
In the Bernoulli equation, which shows the dominant effect of flow in the pipe, the loss head occurs as much as the difference between the pressure head at the entrance and exit of the pipe and flows at the flow rate corresponding to this loss head. Consequently, the effect of changes in velocity is more sensitive than change by pressure.
2.3 Boundary condition and case study
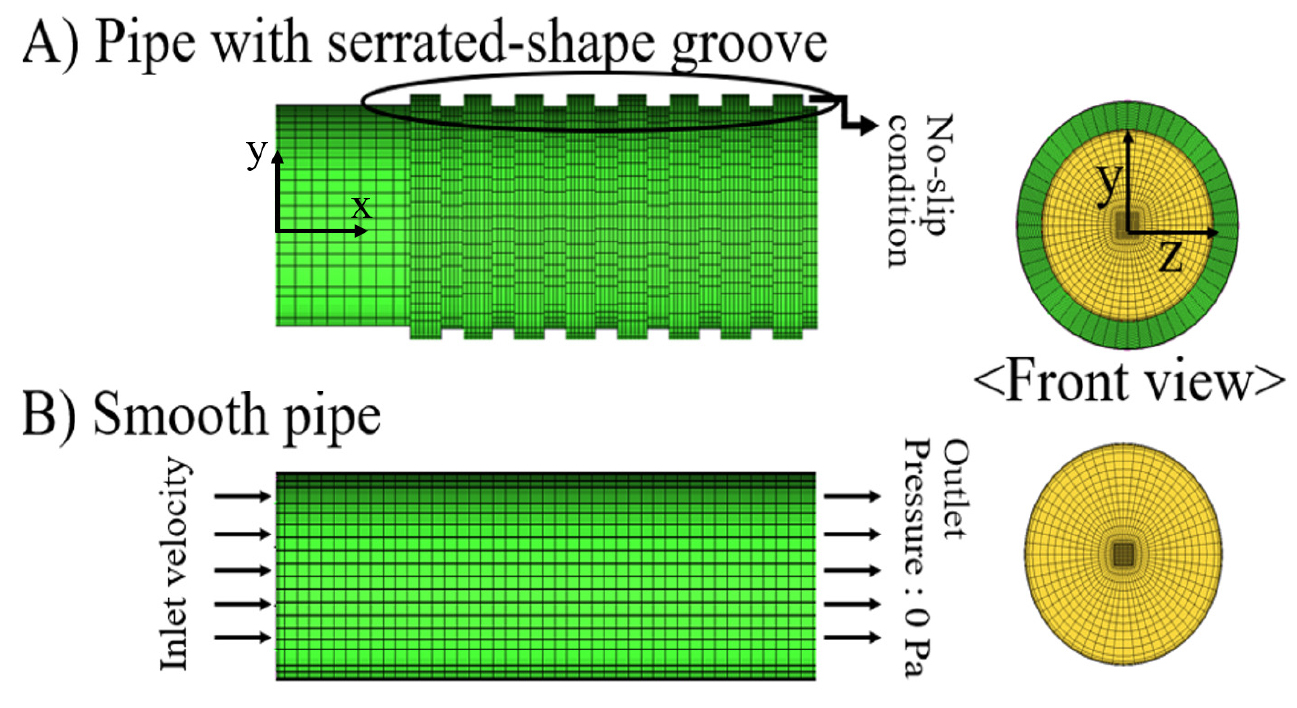
The inlet velocity of the boundary conditions is approximately 2.4, 3.0, and 3.7 as a function of Reynolds number. The pressure-outlet conditions were applied to the exit of the pipe with 0 Pascal.
In the view of the dimensionless vertical distance (y+) on numerical method at the wall, it plays role in considering an effect on the accuracy of the steady and unsteady turbulence model around the boundary layer. In general, for most turbulent models, a dense, y+ of not more than 5 is generally required. However, this value is not absolute, and the numbers varied under the grid conditions of each study statement. Therefore, to satisfy the log-law near the wall, set y+ less than 12. Fig. 4 shows the results of mesh generation with selected grids size and with using the hexahedral mesh. Table 1 represents the case studies according to the pitch and height of grooves and Reynolds number with two types of pipes, which are a smooth pipe and a corrugated pipe with a serrated shape.
3. Result and Discussion
3.1 Characteristics on the velocity
Herein, the effect of the grooves with the shape of serrate was analyzed at the first located groove. Fig. 5 shows plots of streamlines conducted from numerical simulations at the first groove for Reynolds numbers ranging from 55,000 to 85,000.
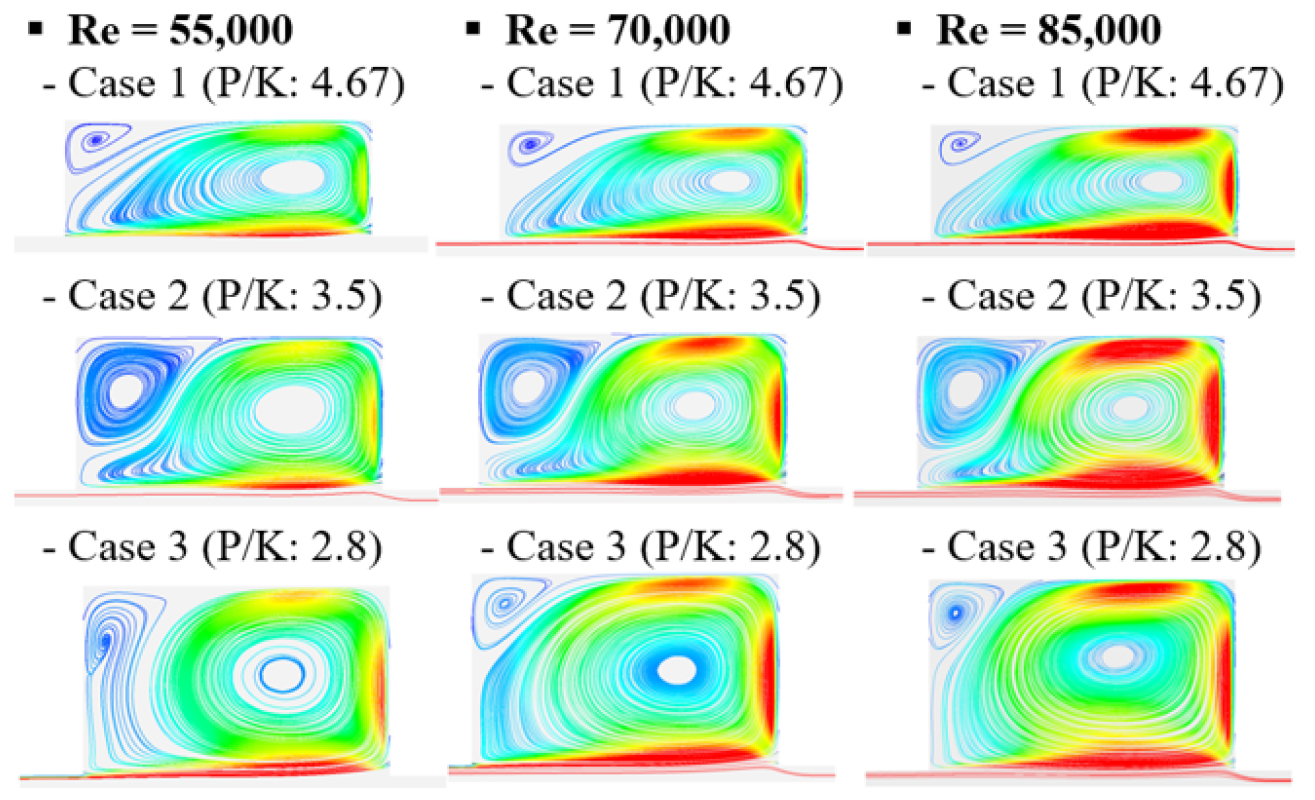
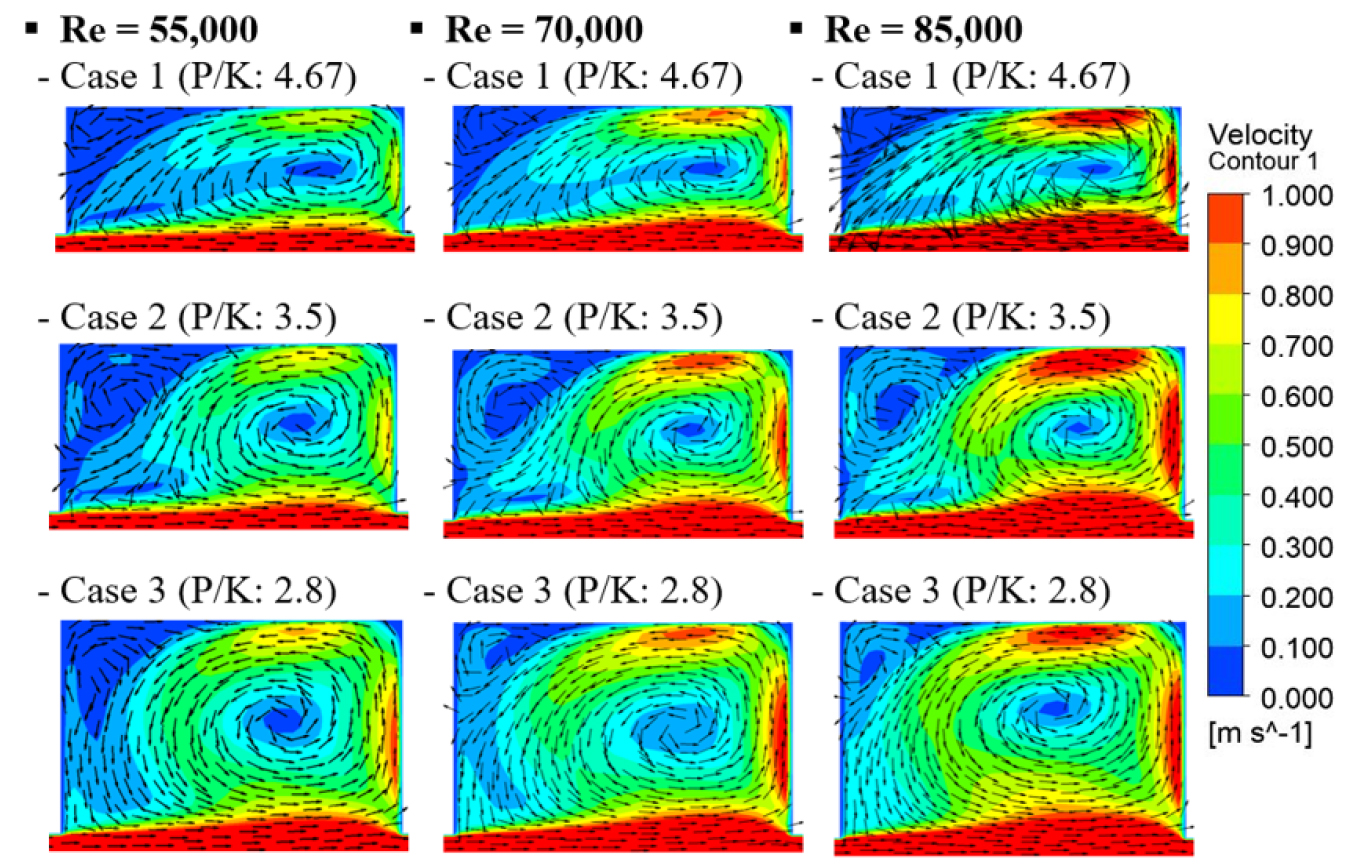
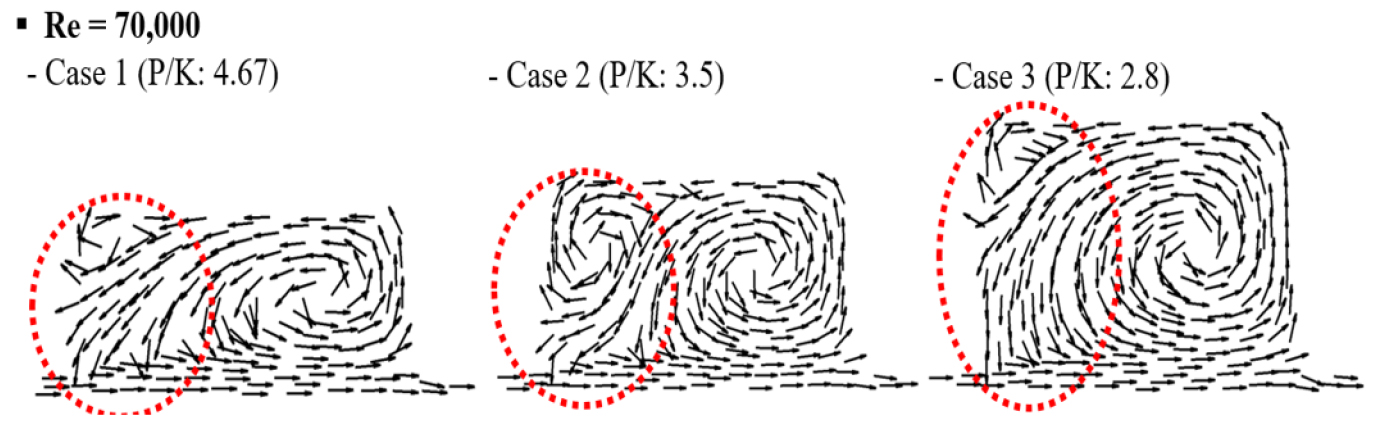
The characteristic of remarkable flow is manifested in the groove inside the pipe. Equally large vortexes were formed counterclockwise and a small form of the second vortex is maintained in the left-upper corner. It can also be seen that the main vortex remains large as the Reynolds number increases. This interesting phenomenon can be investigated by showing a vector plot, showing in Fig. 6. Some fluids can be seen to impact on the groove wall, resulting in some parts of the fluid forced into the cavity and recirculating, the rest forced to turn the ribs to cross the interface line and leave the cavity toward the core flow, and vice versa. When zooming the velocity vector plot, Fig. 7 shows more detailed changes in inflow in the case of 70,000 Reynolds number. The higher the aspect ratio had, the larger the main vortex became. In other words, more flow is combined with the flow-induced from the main flow. Lower heights affect the formation of different vorticities in the upper corner, as shown in the red colou in the left-bottom position.
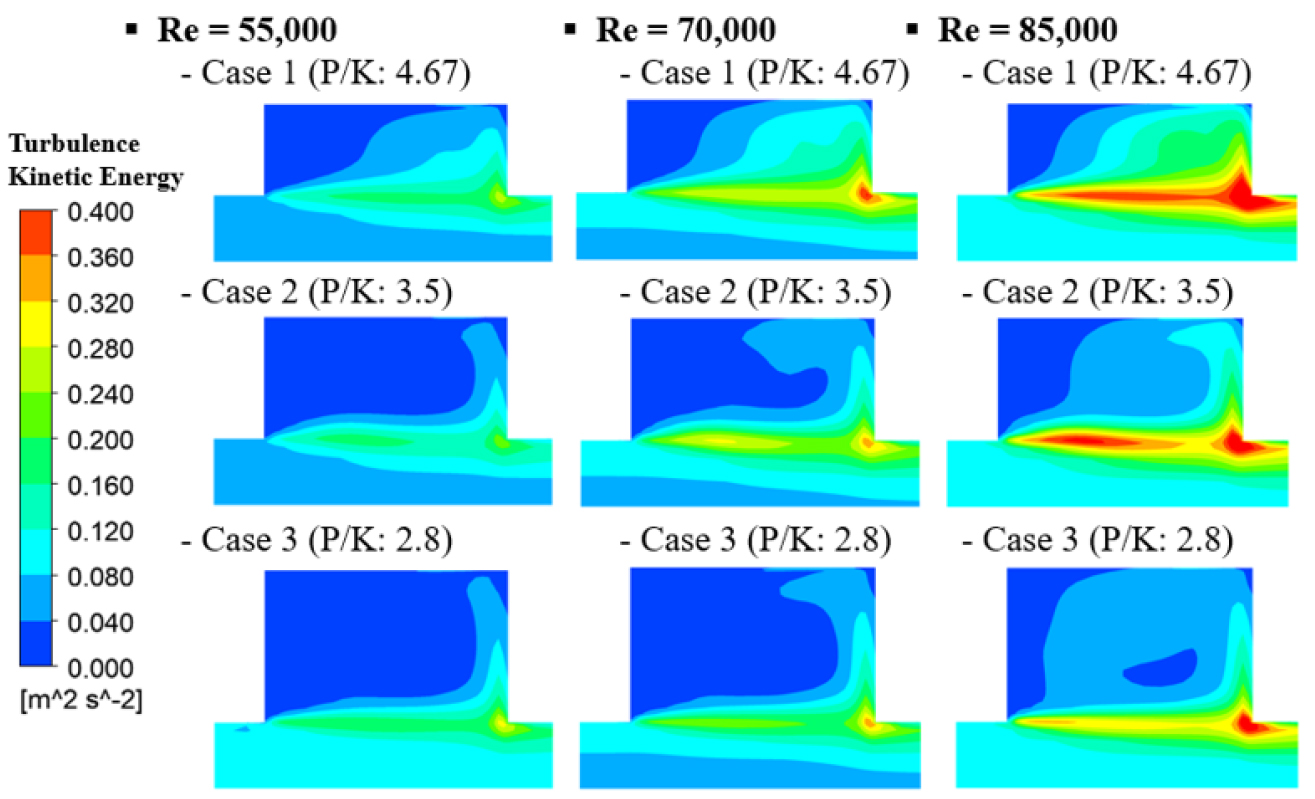
At the top of the groove, represented in Fig. 8, the turbulent kinetic energy is low in all cases, endorsing the assumption that the significant friction effects are only related to the interaction at the interface. The turbulence kinetic energy is indeed significant and may be related to both the effects of the impact against the groove wall and fluctuations at the interface, both of which are amplified by the increase in the size of the groove.
3.2 Characteristics on the pressure drop
The smaller the aspect ratio of the groove, the higher the height of the groove, the lower the pressure drop. This means that the lower the height of the groove, the higher the turbulence kinetic energy is due to the impact on the groove wall and the fluctuation of the flow of the interface, which also affects the pressure drop. This can be analyzed in Figs. 7, 8. representing the vector plot. Troughtout Fig. 9, the pressure drop can be observed according to the aspect ratio that represents the serrated shape within the entire corrugated tube. The smaller the groove height, the larger the Reynolds number, the greater the pressure drop is within the entire corrugated tube.
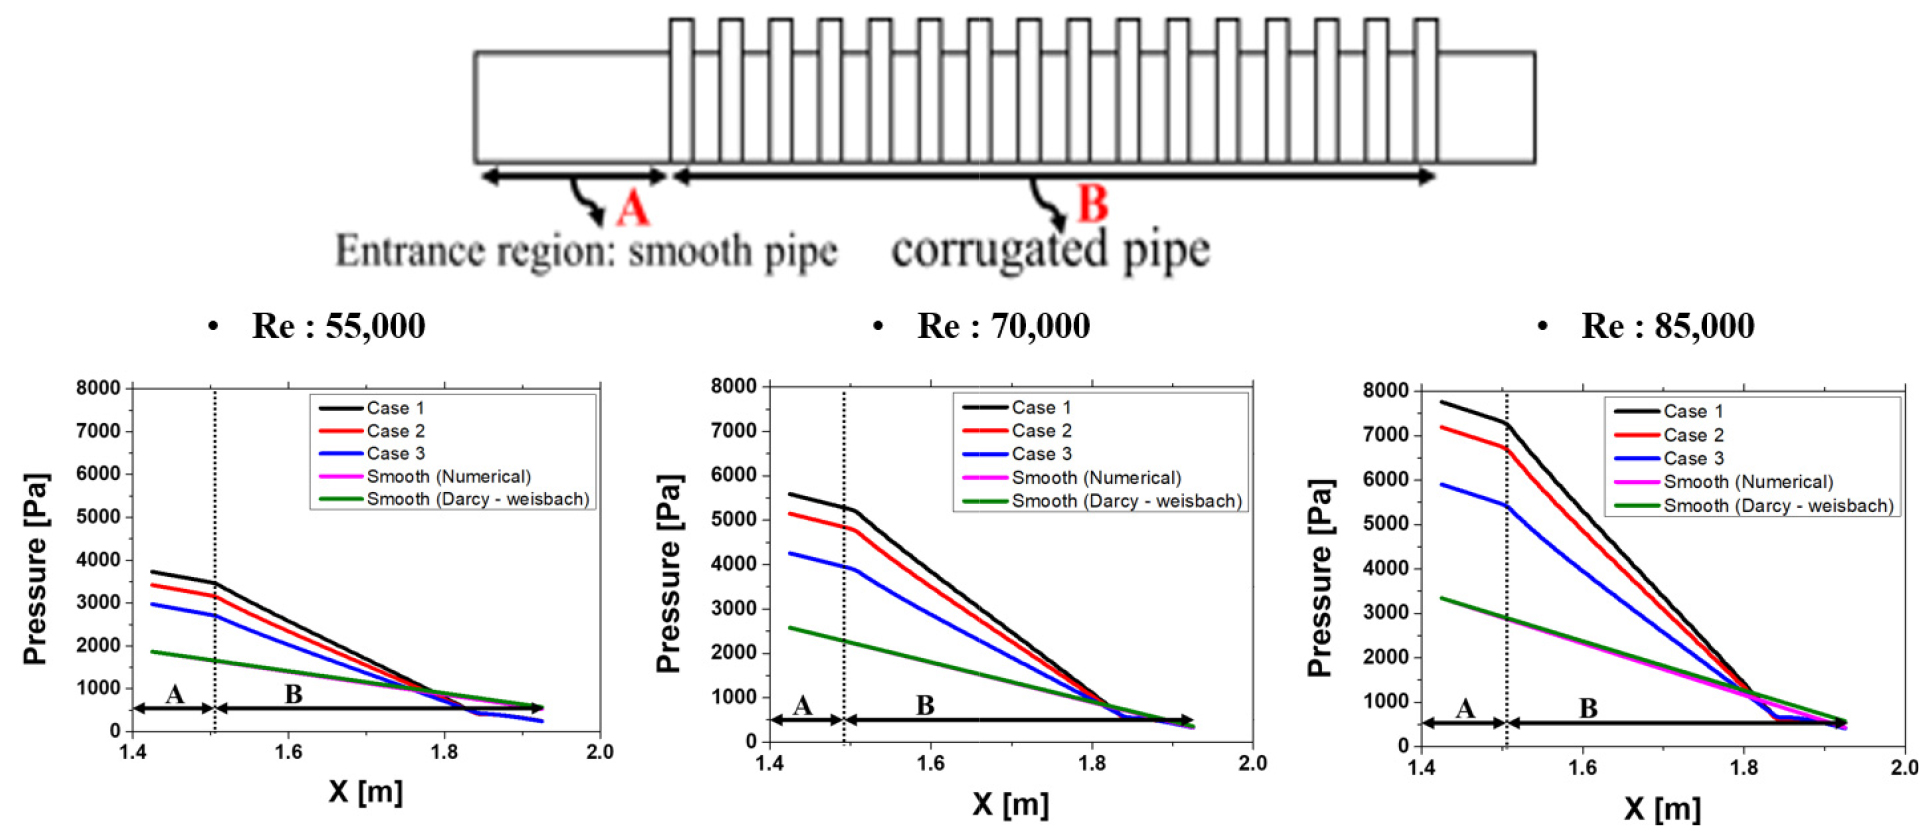
Therefore, it is fact that the height of the groove has a significant effect on the change in pressure drop.
4. Conclusion
In this study, we perform a numerical analysis considering the change in the length (P) and height (K) of the grooves in the D-type corrugated tube where the ratio of pitch (P) and height (K) of the rectangular grooves in the tube is less than 5 for turbulent flow.
When the aspect ratio (P/K) of the pleated tube grooves is 2.8, 3.5, and 4.67, the Reynolds number of internal flows is 55,000, 70,000, and 85,000, and the effect of groove on internal flow was investigated by comparing smooth and serrated pipes as a function of Reynolds number.
The pressure drop in the corrugated tube was interpreted as decreasing with smaller P/K, indicating that the pressure drop is affected by the groove aspect ratio and the recirculation area increases as the groove height increases. We also found that the greater the Reynolds number, the greater the pressure drop.
