

1. Introduction
As the economy develops and the convenience of living increases, the amount of sewage increases every year. The quality of sewage has been deteriorating. As the amount of sewage increases, various kinds of sewage materials are increasing every year to sewage treatment facilities. However, stable water treatment is becoming increasingly difficult as the inflow of non-degradable pollutants and toxic substances increases to the sewage treatment plant. As people become more conscious of the water quality of the river, much interests in the water quality of the sewage are increasing and responding sensitively to the water quality standards. As a result, the central government and municipalities are expanding investment in basic environmental facilities such as water management to create a pleasant living environment. The management of the basic environmental facilities includes not only the maintenance / improvement of the sewage treatment plant, but also the advanced sewage treatment process for the reduction of nitrogen and phosphorus. The government has been striving to stabilize the water quality by enacting the strengthening of water quality standards in 2012 (KEC, 2016).
Since the first modern sewage treatment plant was established in Cheonggye-cheon in 1976, there are about 4,000 large sewage treatment plants nationwide as of 2019 (KEC, 2016). Among them, the medium- and large-scale processing plants have a capacity of about 600, and the number of small-scale processing facilities less than 500m2/day is about 3,400. More than 90% of the treatment facilities operating in Korea are applying advanced treatment processes for the proper treatment of nitrogen and phosphorus, which are the main causes of eutrophication. The advanced treatment processes that remove nitrogen and phosphorous biologically are classified into the main stream process and side stream process. The typical main stream processes include the A2O process, oxidation ditch process, and SBR process. The side stream processes includes the Phostrip process and its improvement, Phostrip II (Wang et al., 2018). Among the main stream processes, the oxidation ditch process is a treatment process developed by Dr. Pasveer of Holland and Muskat Co. of Germany in 1954. It is primarily applied and operated in many wastewater treatment plants of small villages (Ahn et al., 2010). In the sewage treatment, the oxidation ditch process consists of a circular or elliptical channel and a mechanical aeration device is installed. The screened sewage, a physical treatment device, is introduced into the oxidation ditch to start aeration and the sewage circulates at a rate of about 0.25 to 0.35 m/sec. The oxidation ditch is generally characterized by a long retention time (SRT). In order to remove nitrogen and phosphorus, which are the biggest problems in the world, the oxidation ditch process has been developed and many transformation methods have been introduced (von Sperling and Lumbers, 1991). Using the oxidation ditch, the removal rate of organic substances is more than 90% of BOD and more than 90% of SS, The removal rate of T-N, a nutrient salt, is about 30~80% (Lee et al., 1998). The oxidation ditch process requires a large area because of the large hydraulic retention time and has a disadvantage that the nitrogen removal efficiency is somewhat lower than that of the Bardenpho process. On the other hand, the construction cost is low and the treatment efficiency is somewhat efficient, so it is widely distributed in domestic large-scale sewage treatment facilities (20,000~50,000 m3/day).
Currently, the majority of sewage treatment facilities in Korea need to be improved due to the increase in the amount of influent load and deterioration of water quality (Im and Gil, 2017). Various attempts have been made to expand the pretreatment facilities for each treatment site, proper injection of chemicals such as coagulant, and reinforcement of post treatment facilities. This requires a lot of research and investment. In order to improve the efficiency of sewage treatment plant, a system that can optimize the sewage treatment plant using various computer modeling techniques has been implemented (Choi and Chang, 2018). This modeling analyses the various complex operating conditions and data when process simulation is needed to obtain optimum efficiency and provide information on the sewage treatment system. This has made remarkable progress in terms of cost reduction and stability of the sewage treatment plant. In contrast, the majority of wastewater treatment facilities in Korea operate advanced treatment systems but fail to achieve satisfactory water quality and treatment efficiency. This result is due to the lack of basic research that can provide scientific analysis capability and lack of operational information for quick improvement when problems of processing process occur. Therefore, in order to ensure satisfactory drainage quality of sewage, basic research on inflow sewage and treatment process and systematic system to achieve optimal treatment efficiency should be established. For accurate analysis and efficient operation of domestic sewage treatment plants, it is required to develop an online measurement system and to construct a system for analyzing useful data by securing a large amount of data (Huh, 2016).
Recently, the efficiency of the sewage treatment process is increasing due to the construction of sewage treatment system through statistical analysis. In the beginning, a time series chart method which grasps trends by graphing each variable related to process operation status has been introduced and widely used, but a new statistical analysis method was required due to limitations of process variables. In recent years, principal component analysis techniques have been widely used as effective process monitoring (Metcalf and Eddy, 2003) and analysis techniques. However, since this technique can only be performed in two-dimensional analysis, there are many limitations in analyzing complex modern sewage water quality. In order to improve the disadvantages of this method, multidimensional visualization technique has been introduced to make process data analysis more diverse (Pai et al., 2001).
The purpose of this study is to analyze the sewage treatment process using multivariate statistical techniques and to provide information that can improve the process efficiency. Therefore, the operational data of the sewage treatment plant in S city of Gyeonggi-do were collected and analyzed statistically so as to provide basic data of modeling that could implement the optimized operation system of sewage treatment using oxidation ditch method. The box plot, correlation analysis, variance analysis and ANOVA analysis were also performed using R-Studio technique.
2. Materials and Methods
The data in this study were obtained from an oxidation ditch sewage treatment plant located in S city, Gyeonggi-do. The wastewater quality data used in this study were surveyed from a 10 year temporal range of 2007 to 2017 at the sewage treatment plant. The facility capacity information of the detailed treatment process is shown in Table 1.
Table 1. Operating variables of current study
Fig. 1 shows the process diagram of this study on the sewage treatment plant. As ca be seen, the oxidation process is located between the first clarifier and second clarifier. The advanced treatment for treating T-N and T-P is installed at the end of the process. Table 2 shows the design of the oxidation ditch of the general public sewage treatment plant.
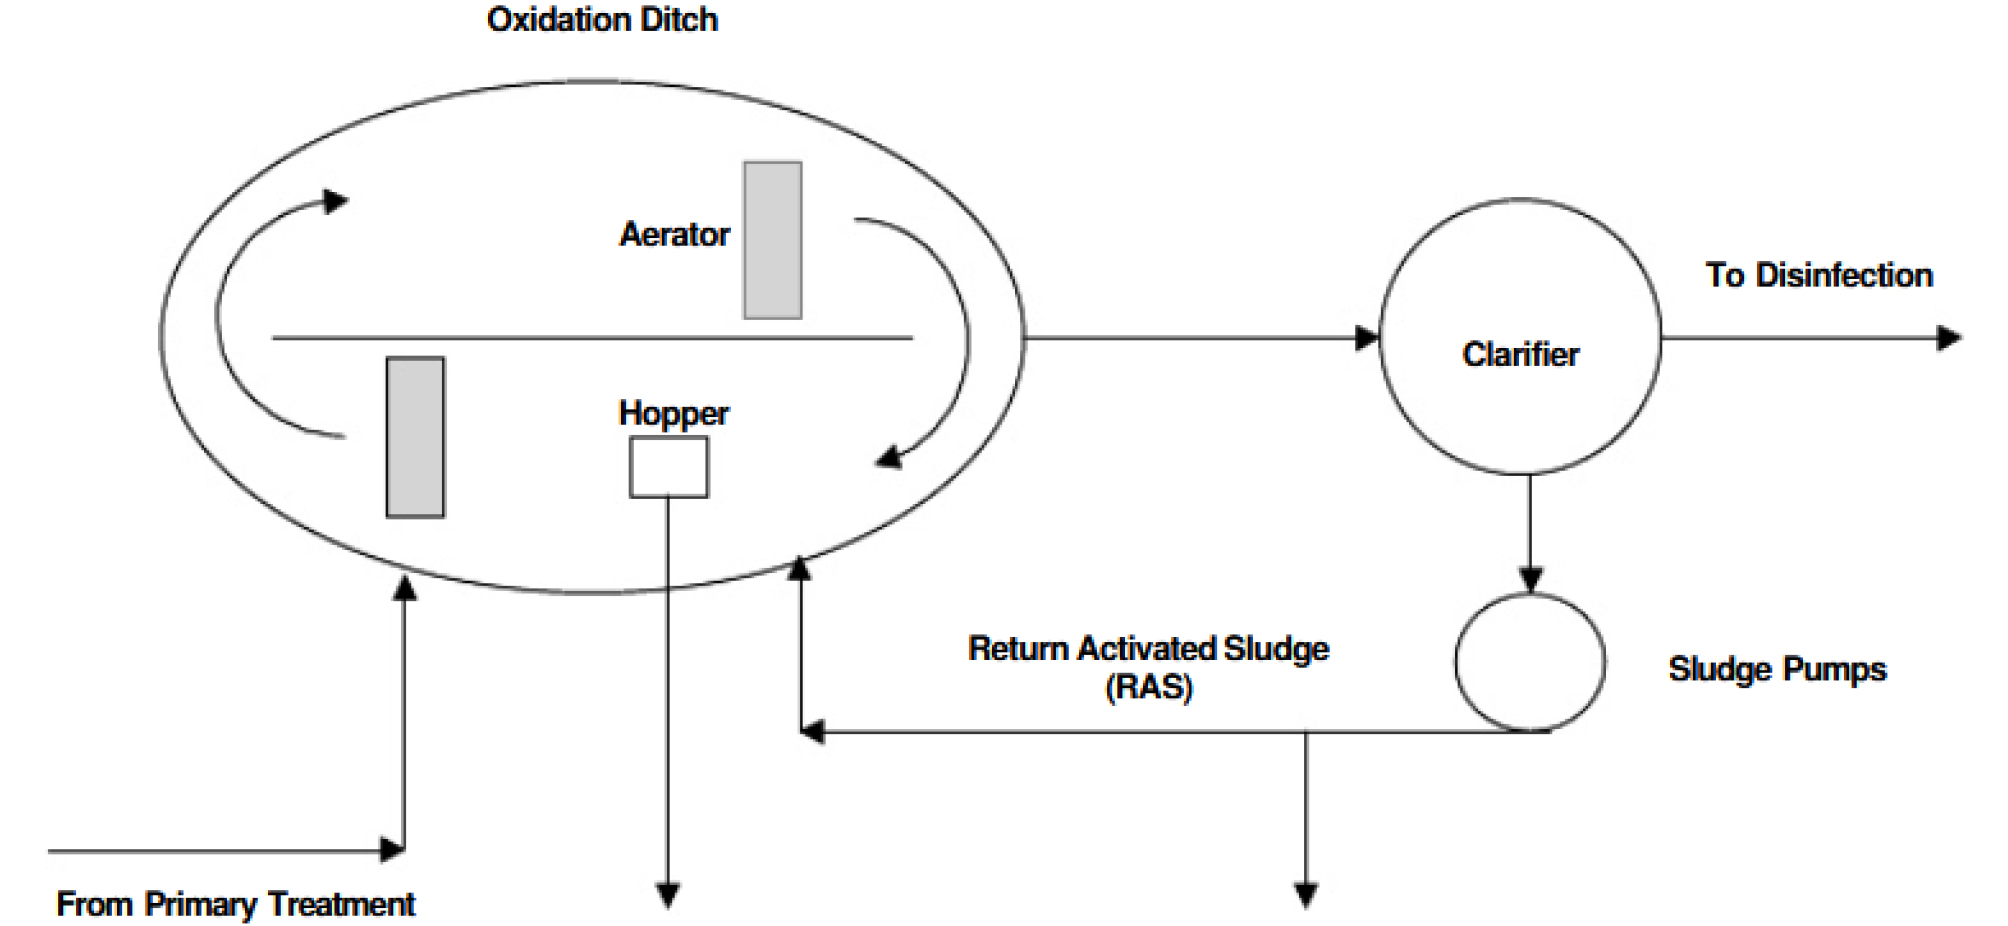
Table 2. Design of oxidation ditch process
| Parameter | Unit | Values 1 | Values 2 |
| Flowrate | m3/d | 4,000 | 4,000 |
| BOD | mg/L | 270 | 250 |
| TSS | mg/L | 250 | 200 |
| VSS | mg/L | 240 | 180 |
| Elevation | m | 500 | 500 |
As mentioned earlier, the sewage treatment performance can be evaluated by statistically analyzing the water quality data of the sewage treatment water. The reliability and suitability of discharged water quality canbe investigated through probability distribution. In this study, runoff water quality and operating factors of the target sewage treatment facility are analyzed using R Studio program which is statistical analysis tool (Huh, 2016). R Studio is a freeware and open source program that easily acquires various algorithms and facilitates various statistical expressions compared to SPSS, SAS and MATLAB (Shaefer and Theodore, 2007). The basic statistical analysis uses the statistical functions of the pastecs package to calculate the minimum, maximum, range, median, mean, The standard deviations for the 50% confidence of the mean, standard deviation, and dispersion coefficient are summarized in the main results.
The basic statistical analysis of this study was performed to analyze the characteristics of operation data of the sewage treatment plant using the oxidation ditch process. The validity of the use of input data of the model was evaluated through statistical anomaly (mean ± 3σ) analysis. The statistical analysis factors were inflow water flow rate, water temperature, pH, BOD, COD, SS, T-N, and T-P. In addition, the flow rate, water temperature, pH, BOD, COD, SS, T-N, and T-P factors for outflow water were analyzed. Basic statistical analysis was performed with min, max, range, median, mean and standard deviation. The water quality could be evaluated with a seasonal classification to analyze the variability. Based on the results of this analysis, box plot was created and the data range is determined. A correlation analysis (Ward, 1963) was carried out between the operation data of the processing plant. The main operating factors, and the cause and effect relationship between the water quality data was also analyzed (Kaiser, 1958). Through correlation analysis, linear relationship between two variables was analyzed and ANOVA is used to evaluate difference of average level in two or more clusters.
3. Results and Discussion
If unexpected situation arises during the operation, an operation map is absolutely necessary to use rather than depending on individual operation engineer (Stehens and Stensel, 1988). These tools allow statistical techniques to provide the most accurate information (Wang et al., 2018).
Statistical analysis was performed to understand the characteristics of operation data of the study facility. The validity of the data using the input data of the sewage treatment process was evaluated through statistical outliers (mean ± 3σ) analysis. The basic statistical analysis factors were flow rate, BOD, T-N, and T-P for influent. In this analysis, seasonal inflow water quality data were analyzed to investigate the specificity of water quality according to season and temperature. The statistical anomalies were not found in sewage treatment operating data. Therefore, the collected operational data was applied as the target factor value for model optimization. In general, not only the problems caused by machinary such as excessive use of pumps due to rainfall in summer, but also the inflow sewage flow rate is more than the design standard. In this case, the efficiency of the aeration tank might be low inflow of organic matter due to low F/M. The statistical analysis results were used, as shown in Fig. 2. The influent quality factors were provided in the box plot. The influent flow rate was the highest in all seasons with an average of 2,500 m3/day in summer and the average data range was 2,000 m3/day, showing more variability than other seasons. It is considered that due to the characteristics of domestic rainfall, the influx of rainfall in summer is larger than other seasons, but the temperature is increasing and the use of water is increased. As shown in Fig. 2, it could be seen that T-N and T-P concentrations were high in summer and autumn. This indicated that the influent load was increased and the HRT was shortened. This was because the nitrification process was not performed properly. The concentration of total nitrogen and total phosphorus was high. Proper operation of the F/M ratio is necessary for smooth operation of the process with high inflow load.
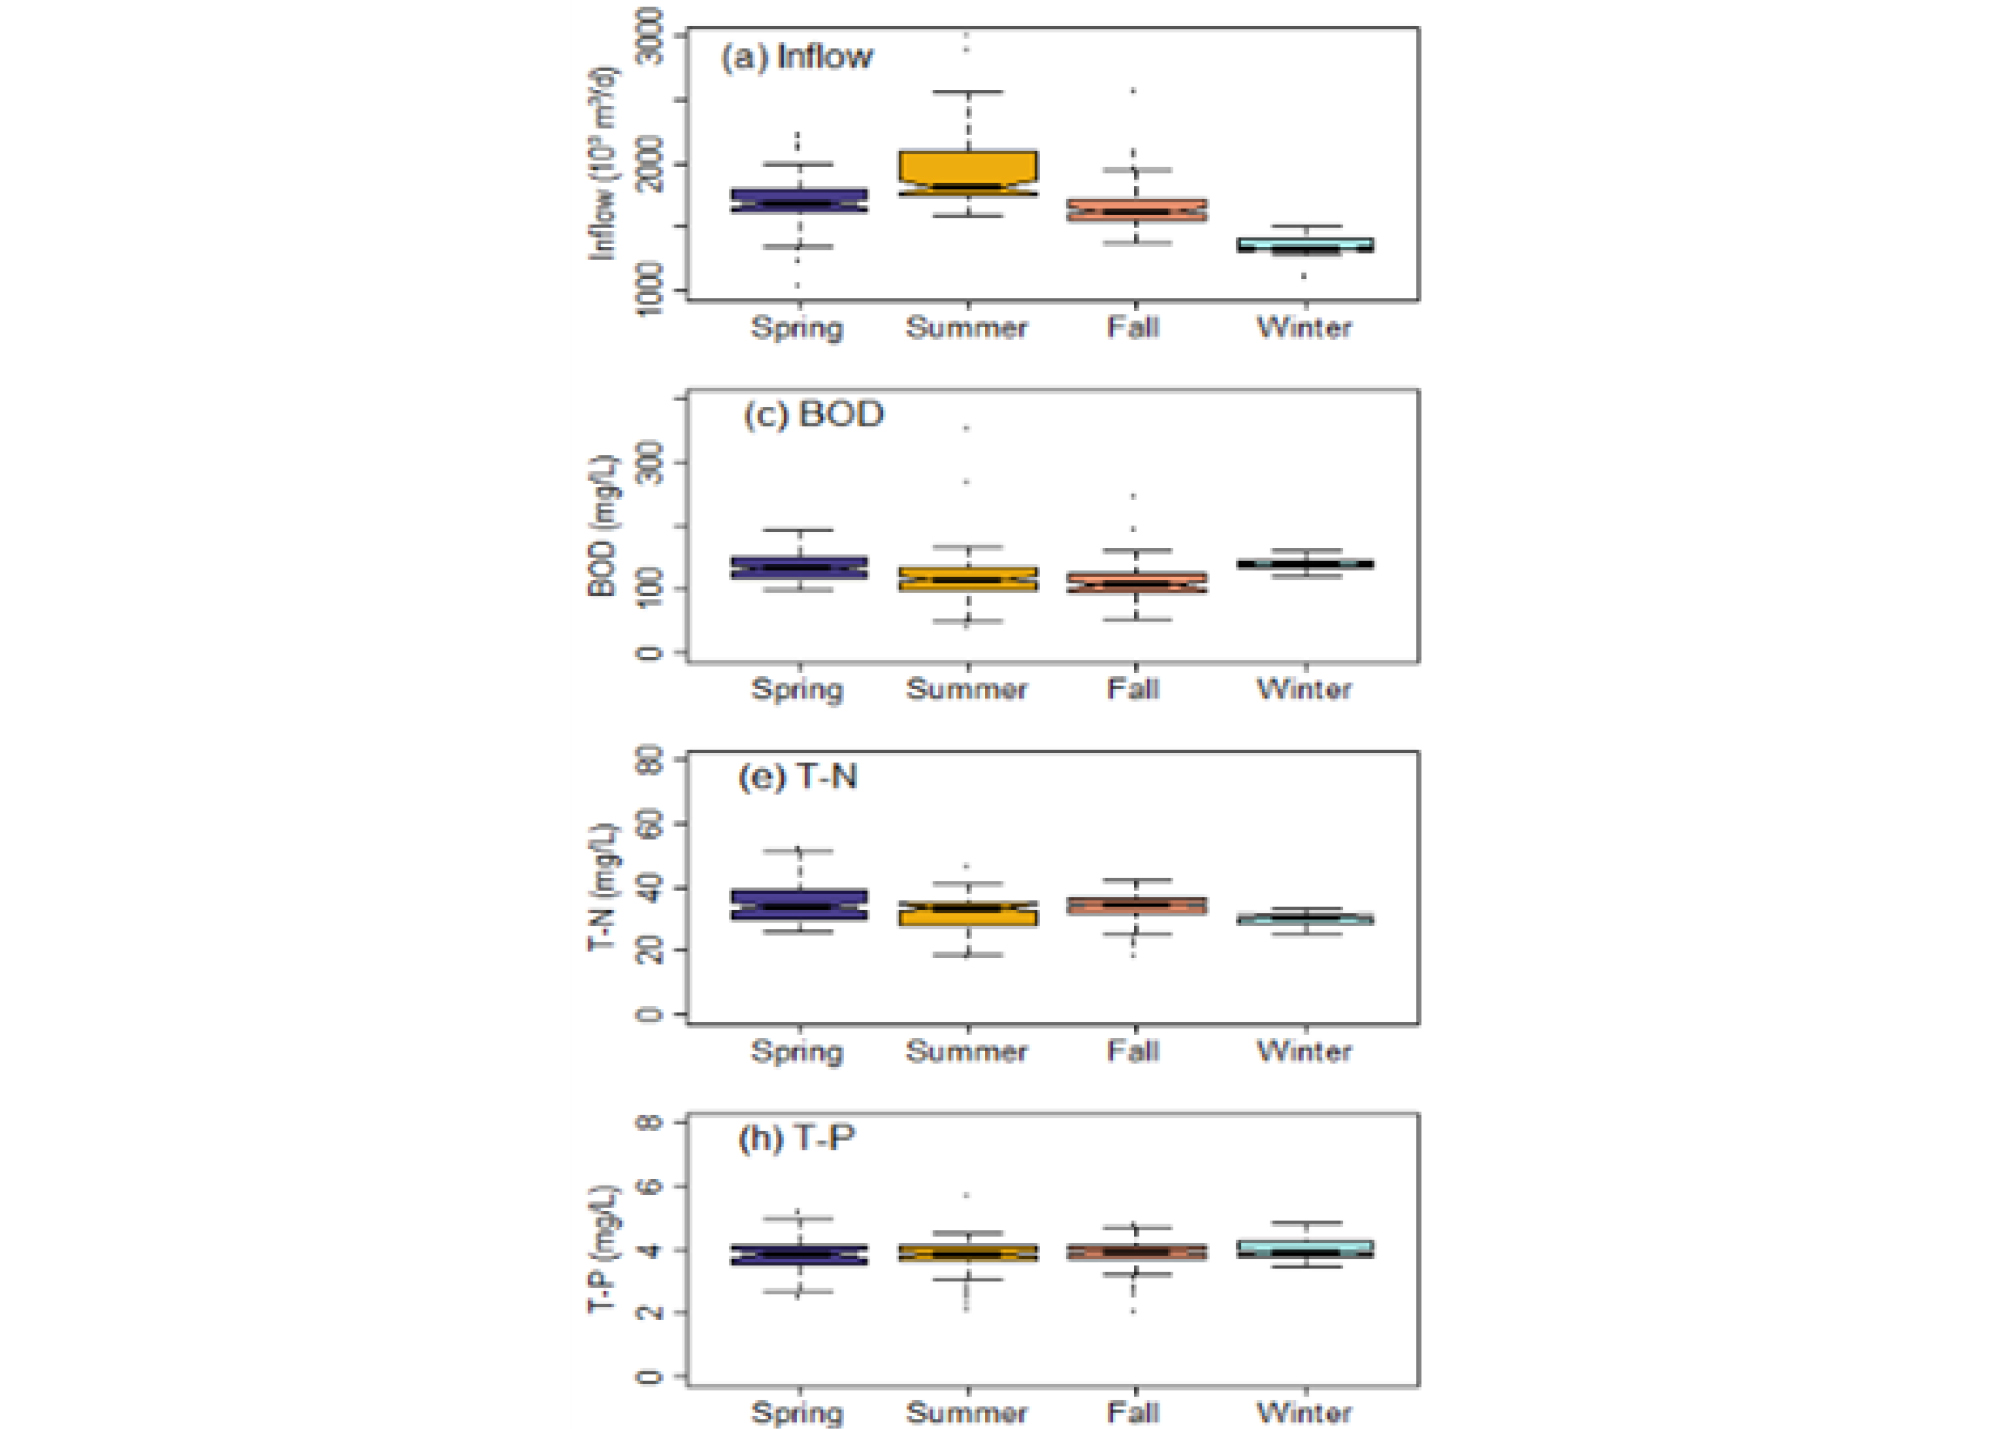
In summer, the influences of rainfall and flow rate into the wastewater treatment facilities were found to be larger than in other seasons. Most of the water quality factors such as BOD, T-N, and T-P were lower than other seasons. On the other hand, as shown in the figure, the fluctuation of factors such as BOD and T-P was larger than the tea season. In spring, the influent flow rate was the lowest, and the lower the concentration of influent water such as BOD, T-N, and T-P. To further investigate the seasonal variability of water quality, the analytical parameters of effluent water quality were analyzed by box plot and the results are shown in Fig. 3.
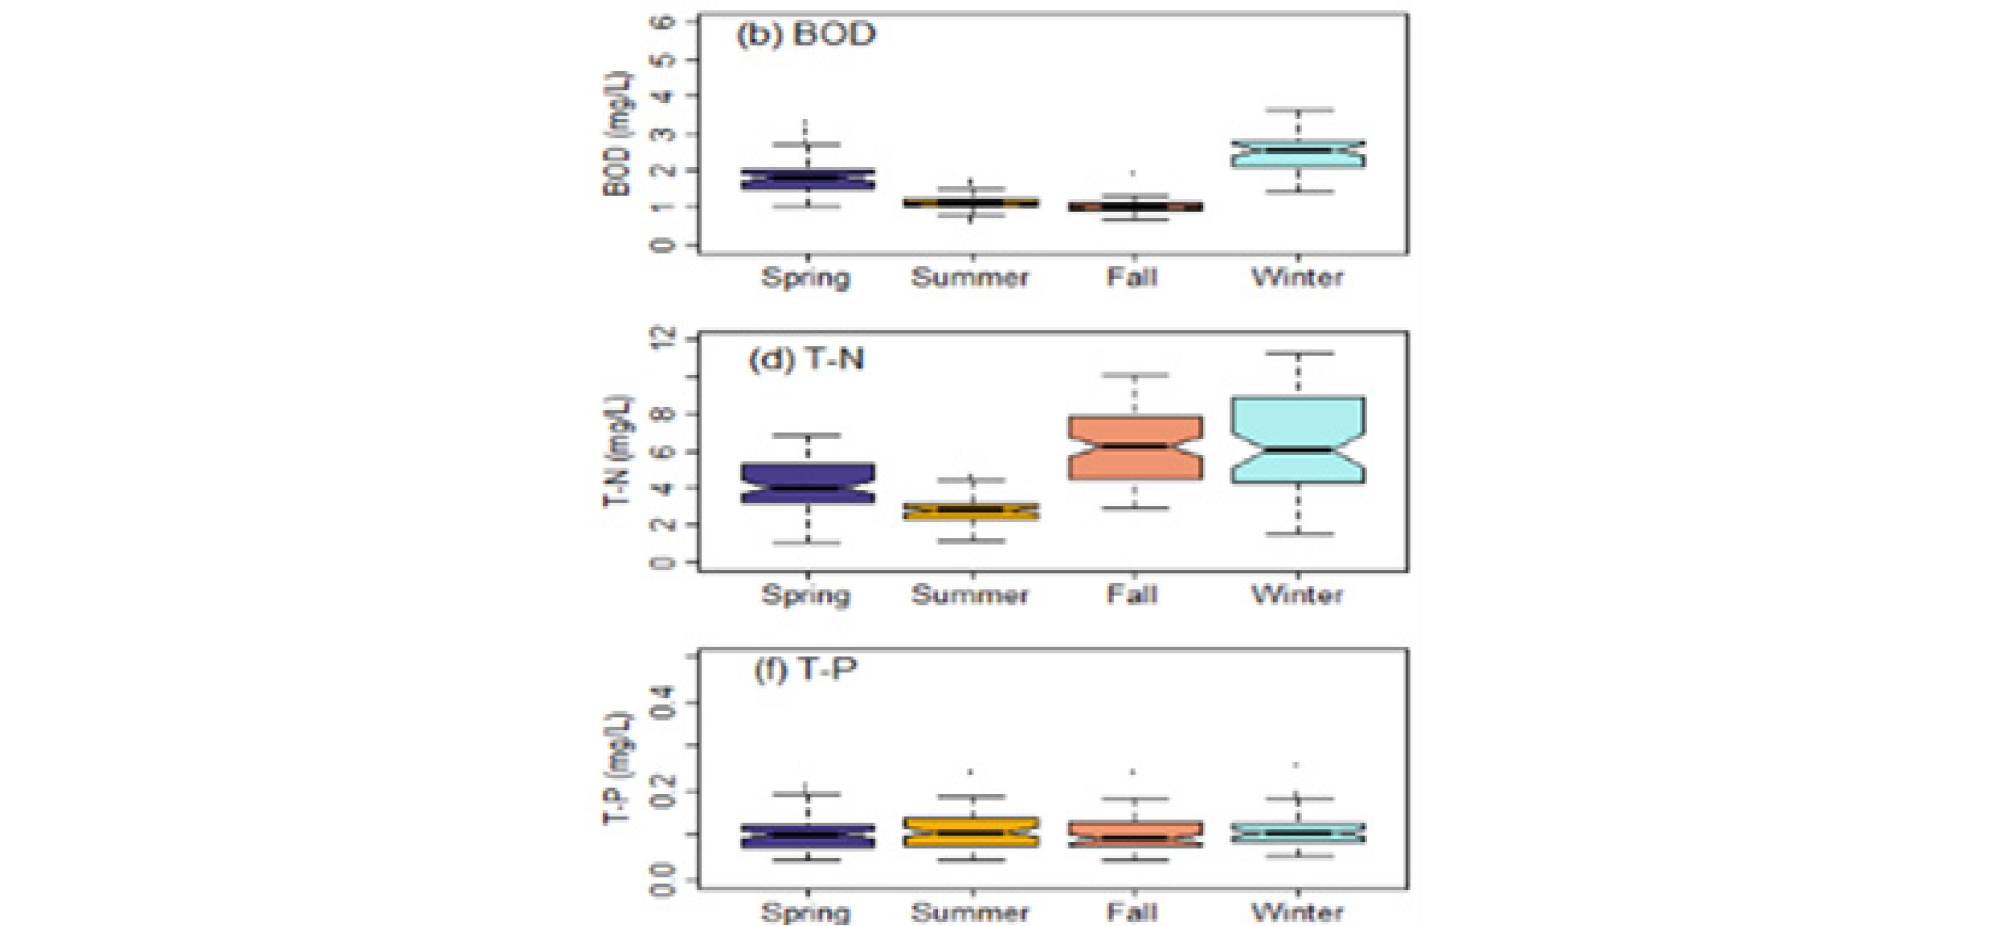
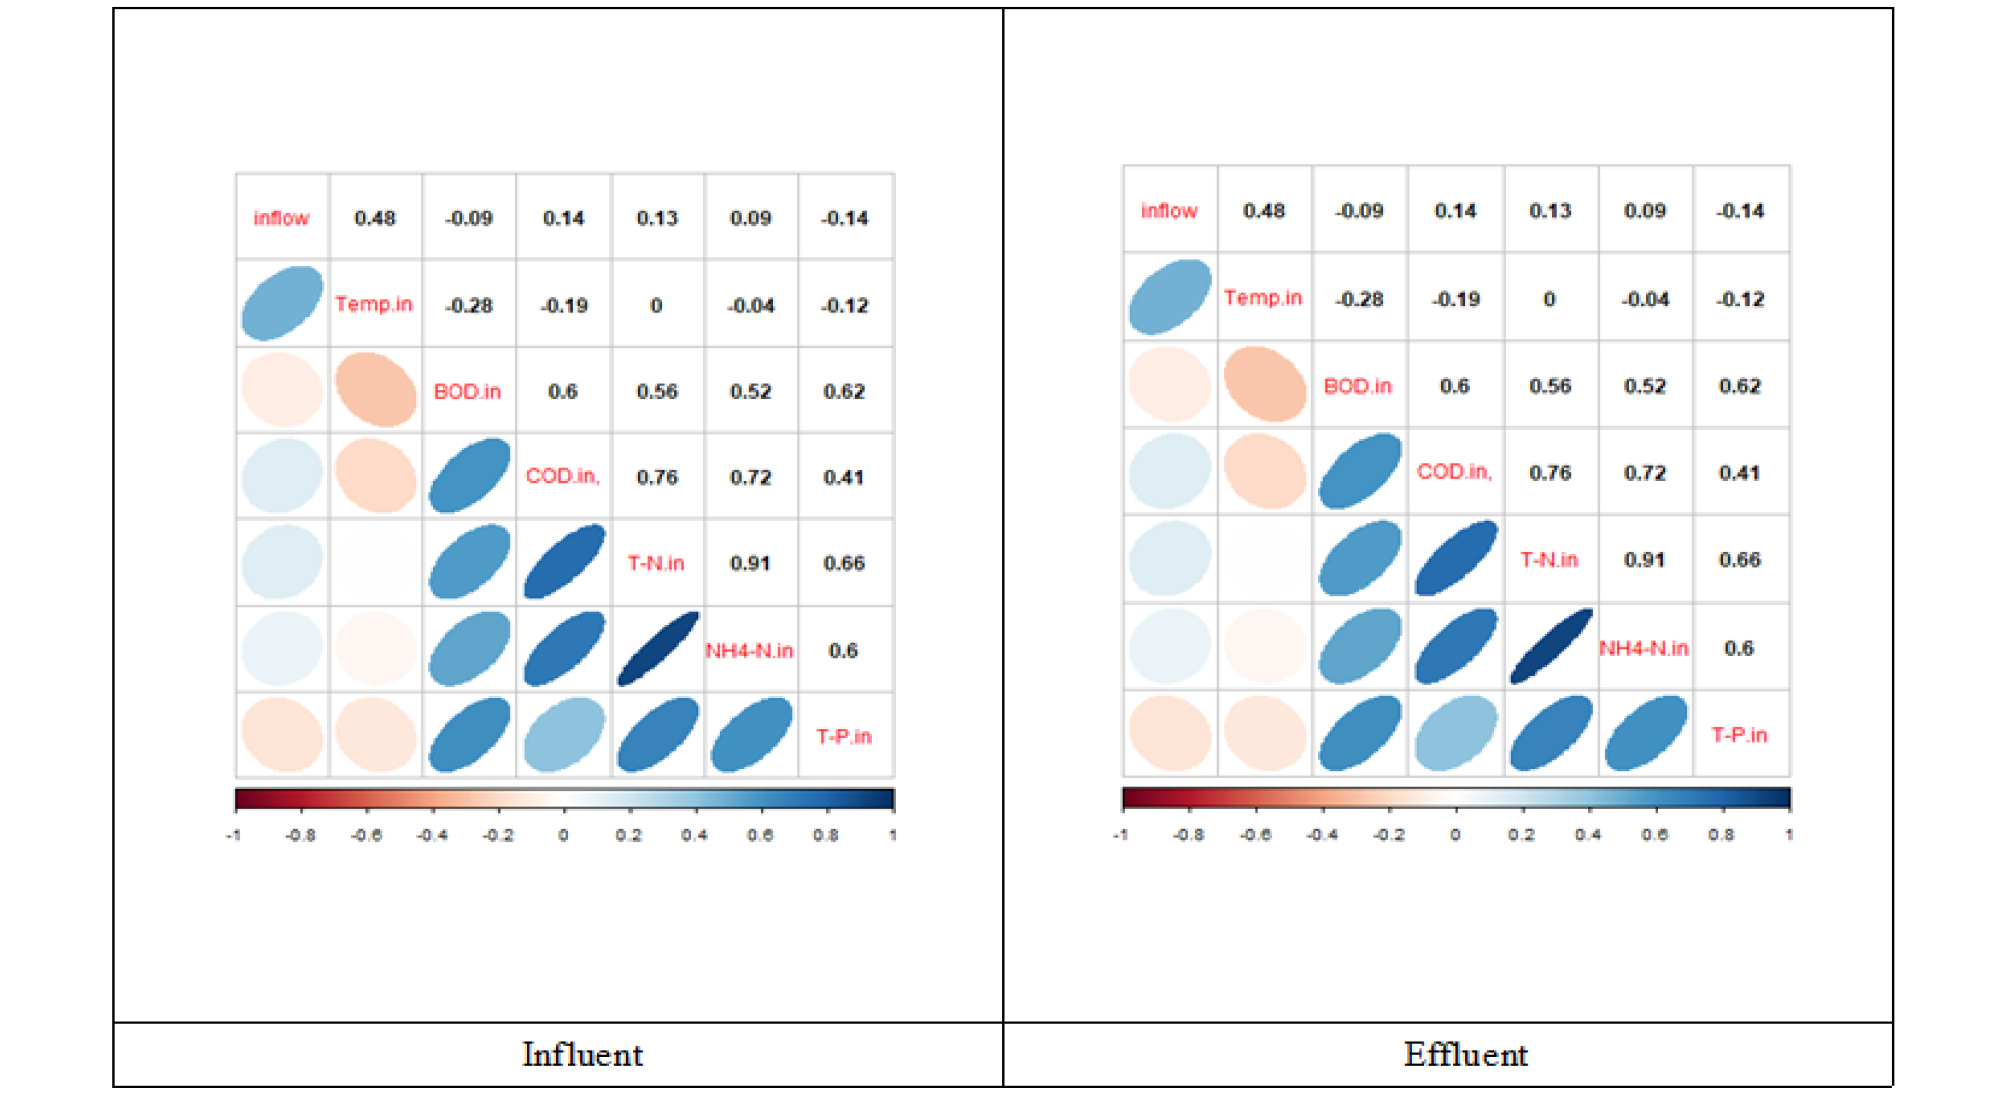
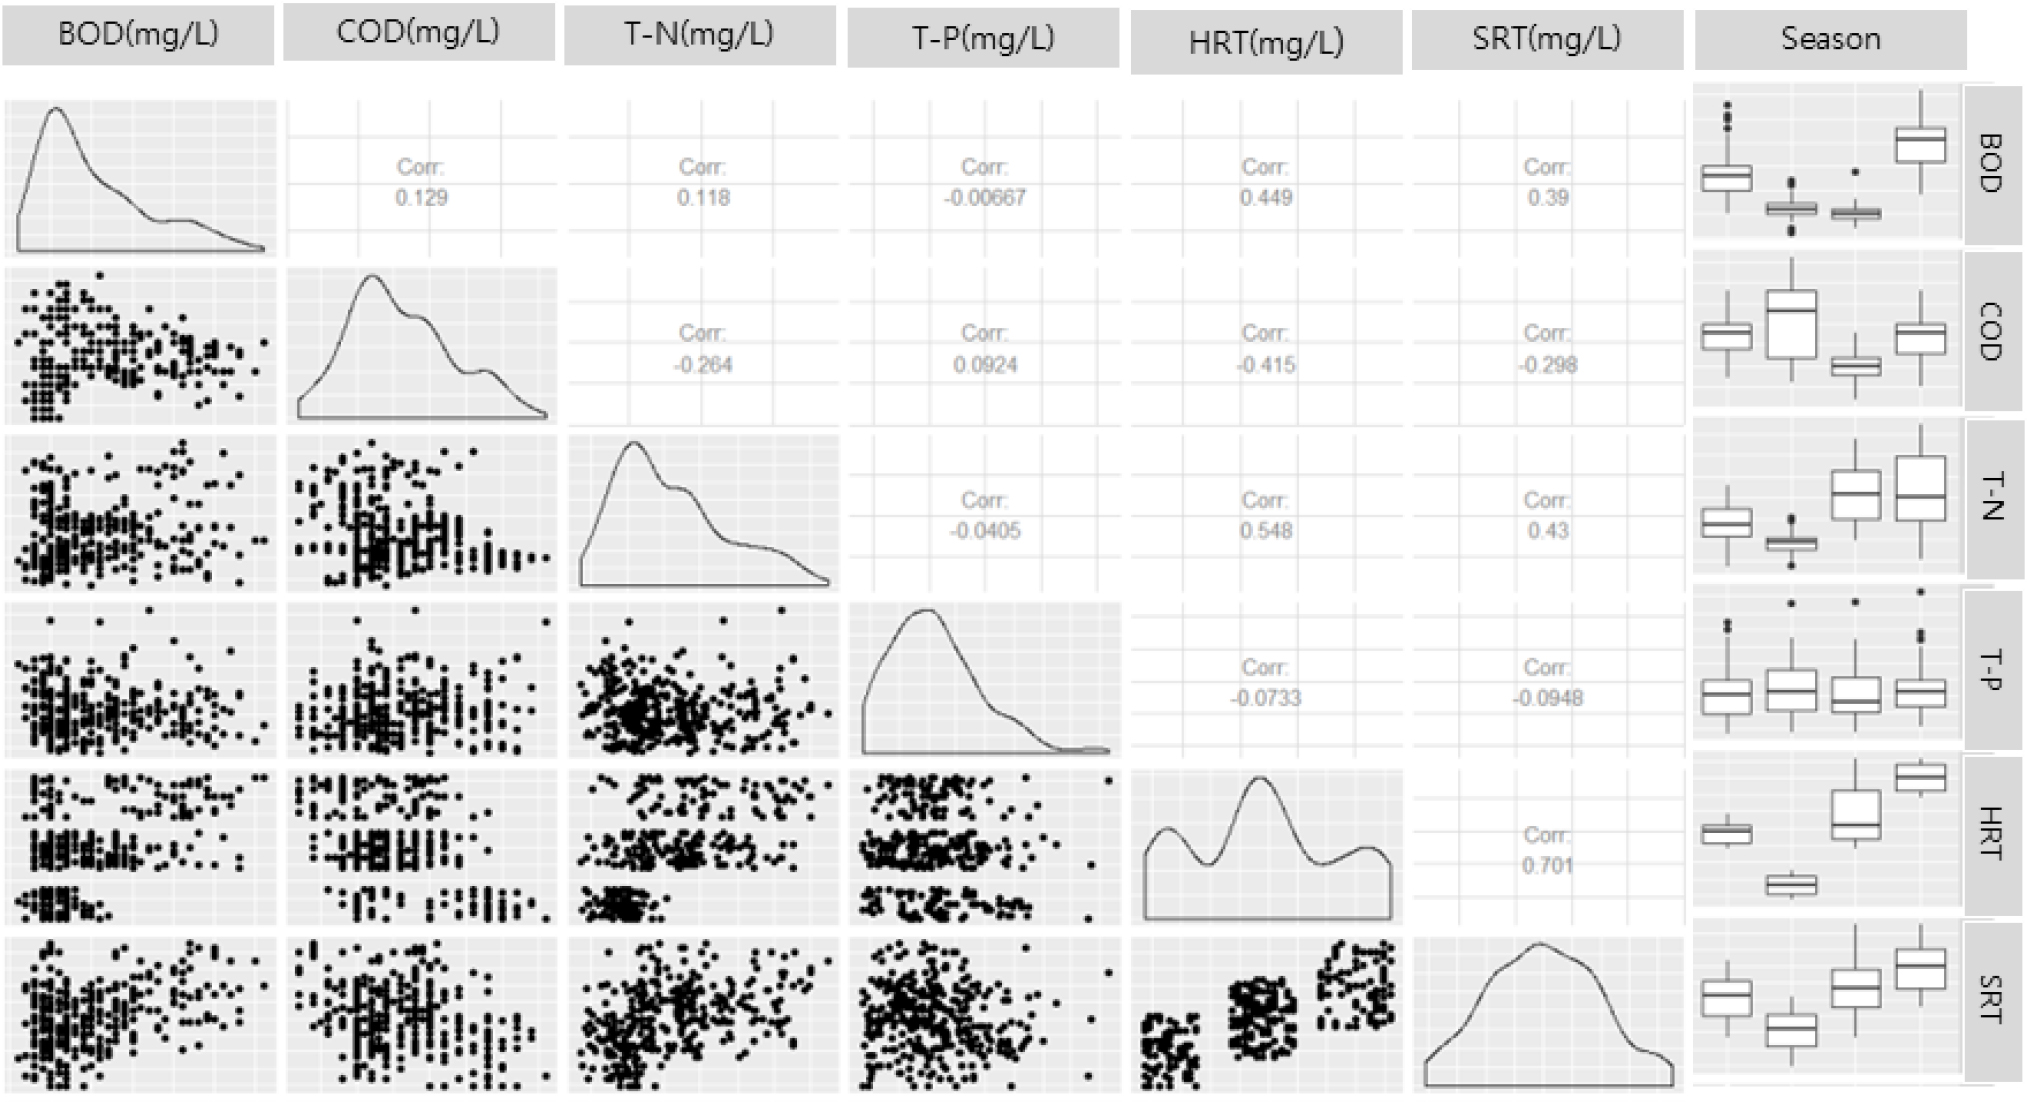
Both influent and effluent water quality was analyzed by season. BOD concentrations were in the order of winter > spring > autumn > summer. T-N effluent concentrations were in the order of autumn > winter > spring > summer. In addition, COD, NH4+-N and T-P factors showed similar water quality without differences between fishes. Pearson correlation analysis was performed to investigate the correlation between water quality in influent. Based on seven factors including BOD, COD, T-N, and T-P, the analysis examined the influencing factors affecting water quality by correlating the relationship between influent water quality and effluent water quality.
As shown in Fig. 4, the BOD, T-N, and T-P factors of the influent water quality showed a strong positive correlation. On the other hand, BOD showed a strong negative correlation with influent water temperature and positive correlation with HRT, SRT and C/N. Therefore, as the influent water temperature increased, the BOD concentration decreased and the BOD treatment efficiency decreased as the residence time increased. The COD factor showed a negative correlation with HRT, SRT, and DO. T-N showed a positive correlation with the operational factors HRT, SRT, and DO. This means that the T-N effluent concentration increased as the retention time increased and the higher DO concentration was maintained. The correlation corresponding to the T-P factor, on the other hand, was weak.
The results of water quality factor and seasonal distribution of relative data are summarized in Fig. 5, where BOD showed a high correlation and a posterior correlation in summer. According to the distribution of clusters by water quality factors, BOD was discharged in higher concentration distribution The higher concentration range in spring and winter was appeared than in summer and autumn. T-N was discharged at a low concentration in autumn and cluster formation on the right side was observed. On the other hand, T-P showed a uniform distribution of effluent concentration regardless of the season.
The ANOVA test was performed with independent variables of BOD, T-N and T-P for each season to investigate whether the effluent water quality was affected by the seasonal changes. The results are shown in Table 3. Effluent water quality and seasonal analysis showed that the p-value of T-P was greater than 0.1. This analysis showed that T-P was not seasonally affected. The water quality factors except T-P showed a p-value of less than 0.1, indicating that the effluent water quality varies depending on seasonal effects.
Table 3. ANOVA results of effluent water characteristics
| Variables | DF | SS | MS | F value | P value |
| BOD | 4.5 | 90 | 50 | 220 | <0.001 |
| T-N | 5 | 100 | 150 | 94.25 | <0.001 |
| T-P | 2.5 | 0.3 | 0.001 | 1.0 | 0.1 |
4. Conclusion
To improve the operational efficiency of the public sewage treatment plant operated using the oxidation ditch process, statistical analysis was conducted using the operational data of the last 10 years. The correlation analysis and analysis of variance, and ANOVA were performed. Based on the analysis evaluating the appropriateness of applying oxidation ditch and used as the basis for the simulation might be improved the efficiency of the plant. The conclusions might be as follows:
1. Analysis of seasonal operating data revealed the highest inflow rate in summer and greater volatility than in other seasons. This was due to the influx of large amounts of rainfall and increased water usage in summer.
2. Seasonal BOD effluent concentrations were in the order of winter> spring> summer = autumn, and the effluent water concetration of T-N was in the order of autumn> winter> spring> summer. In addition, COD, and T-P showed similar effluent water quality.
3. Pearson's correlation analysis showed strong correlation between influent quality factors of BOD, TN, and T-P. BOD showed a strong negative correlation with temperature and a positive correlation with the operating parameters such as HRT, SRT and C/N. Therefore, As the incoming water temperature increased more in the effluent flow BOD concentration was decreased, the longer the residence time could be determined to decrease the effect of reducing the BOD concentration.
